
Figure 3.
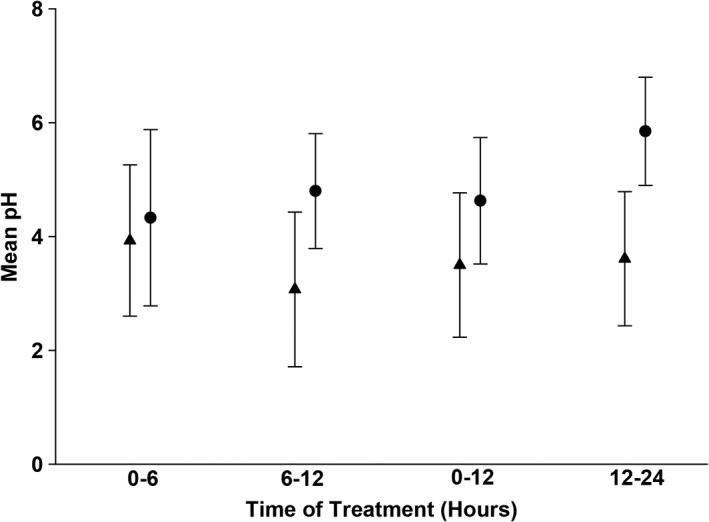
Onset of famotidine action as assessed by mean pH on day 1. Circles represent the mean pH ± SD for dogs receiving continuous rate infusion (CRI). Triangles represent the mean pH ± SD for dogs receiving twice‐daily IV dosing. Please refer to Table 1 for the number of animals on each day for both treatment groups