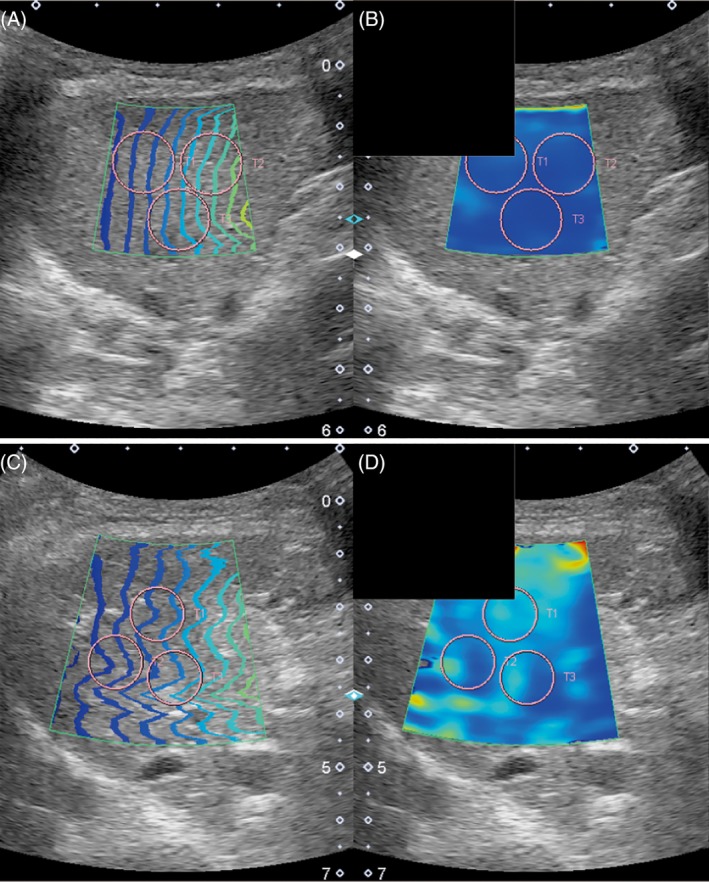
Figure 1.

Representative images of the right lobe of the liver using the intercostal approach for the speed mode in a dog without clinically relevant hepatic fibrosis (F0, A0; A and B) and a dog with clinically relevant hepatic fibrosis (F3, A0; C and D). Images are the proper propagation map (A, C) and the speed map (B, D). Notice the consistent parallel contour lines for the speed modes, and the region of interest (T1, T2, and T3; 10 mm) used for the measurements (circles)
