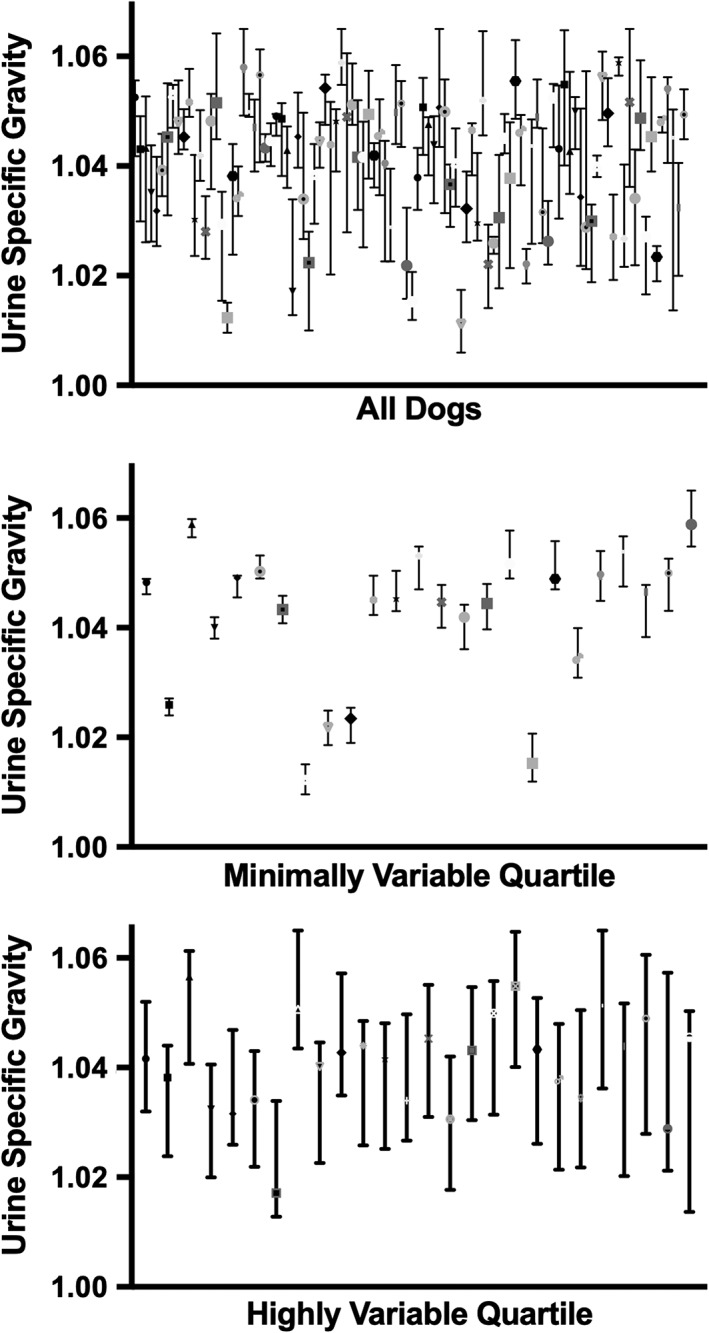
Figure 1.

Data from all dogs were analyzed and separated into quartiles based on the range of urine specific gravities measured over the course of the study. Median and range of first morning urine specific gravities are graphed for individual dogs. The graphs represent data from all dogs in the study, the data from dogs in the least variable quartile, and data from the dogs in the most variable quartile
