Figure 2.

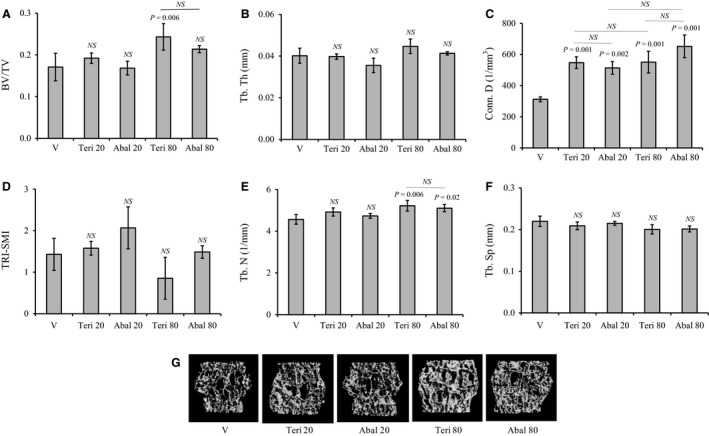
Effects of abaloparatide and teriparatide administration on vertebral trabecular bone architecture: Female C57BL/6J WT mice were SC injected daily, except Sunday, with vehicle or 20–80 µg/kg/day teriparatide or abaloparatide for 30 days. L5 vertebrae were isolated, fixed, and analyzed by micro‐CT. (A) BV/TV is trabecular bone volume/total volume. (B) Tb. Th is trabecular thickness. (C) Conn. D is trabecular connectivity density. (D) SMI is trabecular three‐dimensional structure model index. (E) Tb. N is trabecular number. (F) Tb. Sp is trabecular spacing or separation.(G) Images: Examples of L5 micro‐CT scans. The statistical designation directly listed on the top of each bar indicates the significance level in comparison to vehicle. Statistical significance levels between other experimental groups are shown using the drawn lines. The data in all graph are expressed as the means ± SD. N = 5 mice/group. NS is not significant. V is vehicle, Teri 20 is teriparatide 20 µg/kg/day, Abal 20 is abaloparatide 20 µg/kg/day, Teri 80 is teriparatide 80 µg/kg/day, and Abal 80 is abaloparatide 80 µg/kg/day.
