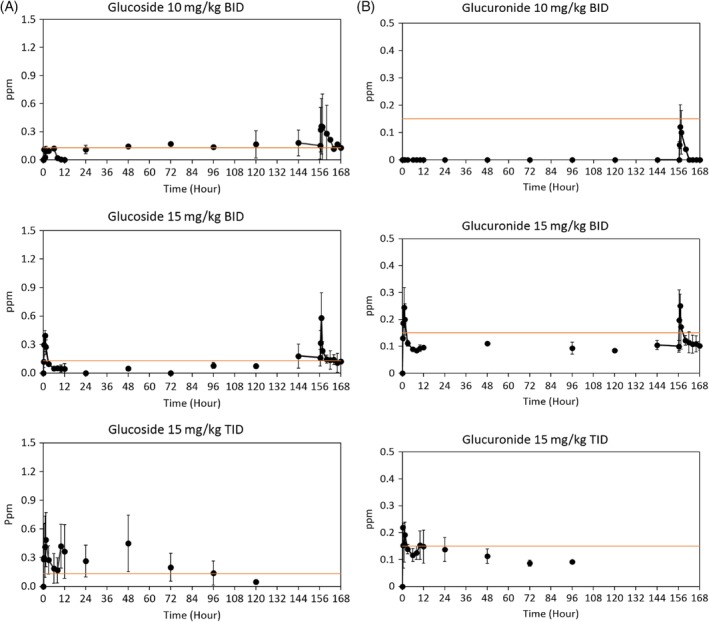
Figure 3.

A, MPAGls concentrations for all treatment groups. *Orange line reflects that many values shown were below the lower limit of quantification but above the lower limit of detection. B, MPAG concentrations for all treatment groups. *Many values shown were below the lower limit of quantification but above the lower limit of detection
