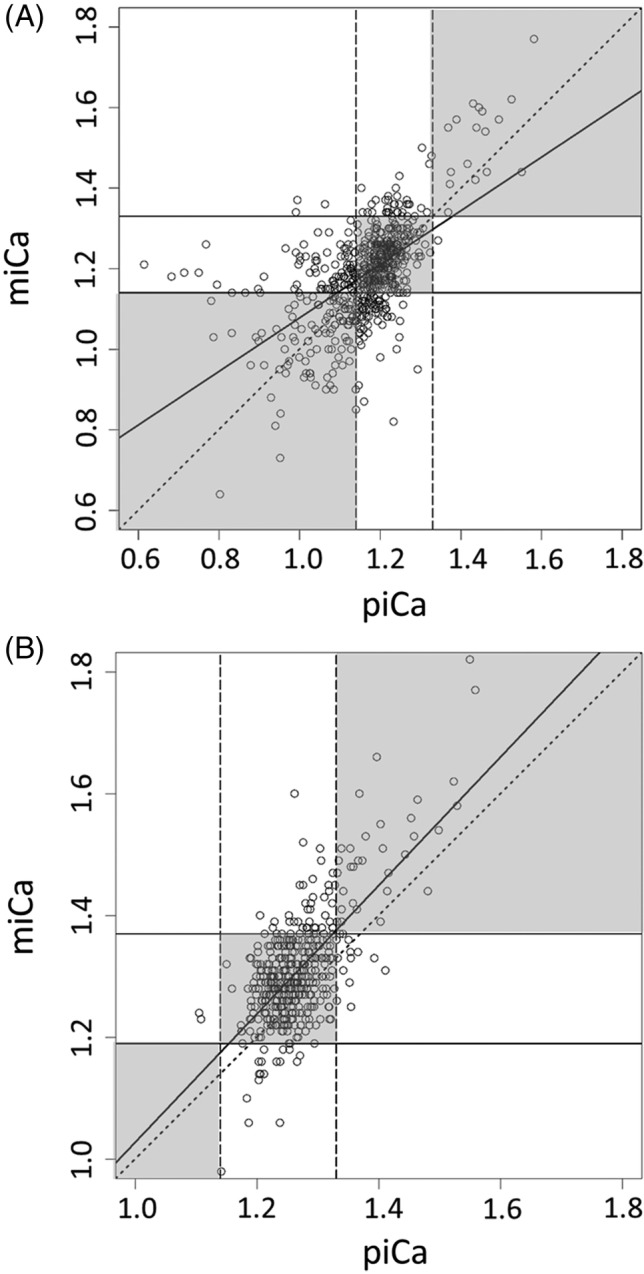
Figure 2.

Observed‐versus‐predicted plot showing the relationship between measured and predicted ionized calcium in the (A) test set and (B) external set. The upper and lower limits of normocalcemia are represented by the vertical dashed lines for the predicted ionized calcium (1.14‐1.33 mmol/L), and the horizontal solid line for the measured ionized calcium (A: 1.14‐1.33 mmol/L; B: 1.19‐1.37 mmol/L). The diagonal dotted line represents the first bisector, on which predicted ionized calcium values that perfectly match measured ionized calcium fall in. The thick solid line represents the regression line. Points that fall within the three gray boxes along the first bisector were properly classified by predicted ionized calcium, and those points outside these gray boxes were misclassified by predicted ionized calcium. miCa, measured ionized calcium; piCa, predicted ionized calcium
