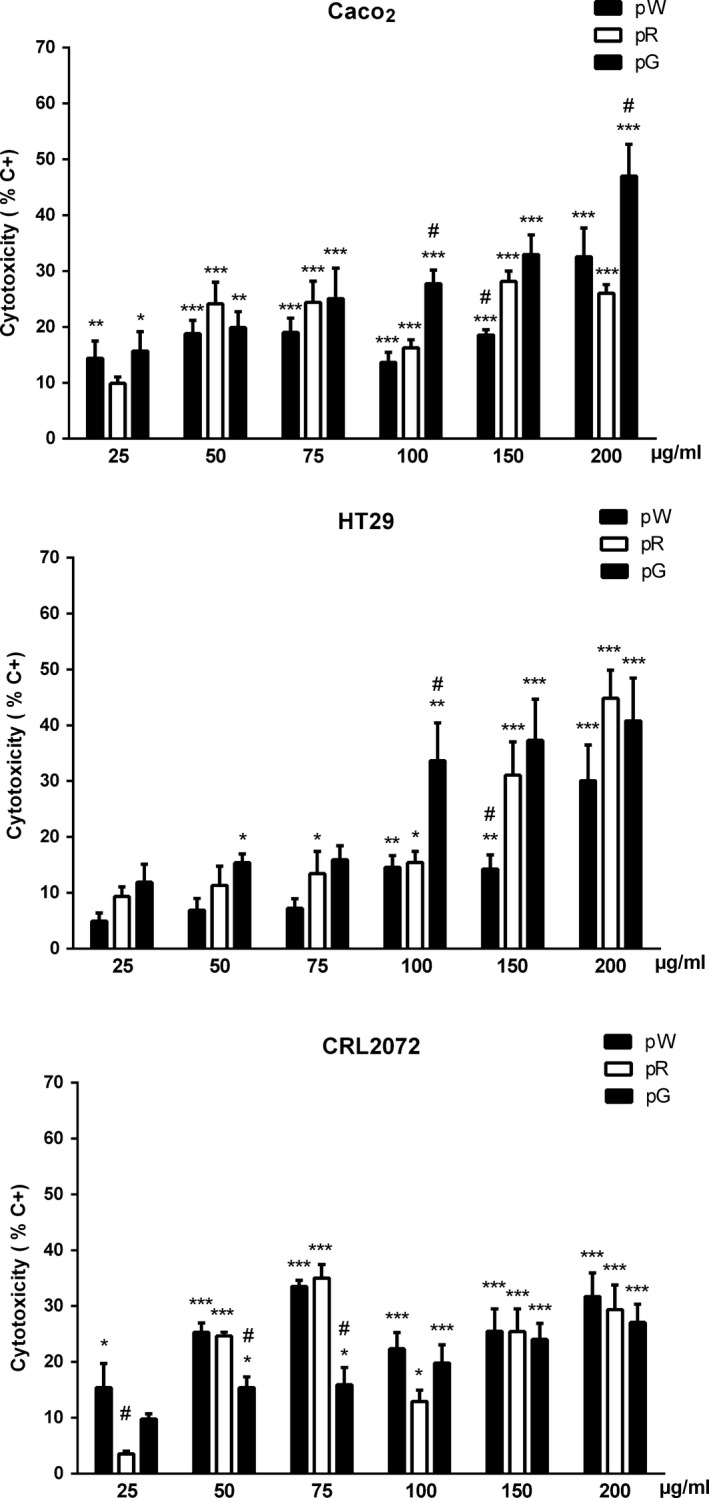
Figure 4.

Cytotoxicity of purified extracts on Caco‐2, HT‐29, and CRL2072 cells (pW = white pomace; pR = red pomace; pG = grape seed), quantified with the LDH test. Bars represent means ± SEM. *p < .05, **p < .01, and ***p < .001 respect to negative control group (0.5%–1% cytotoxicity). # p < .05 respect to other extracts at the same concentration
