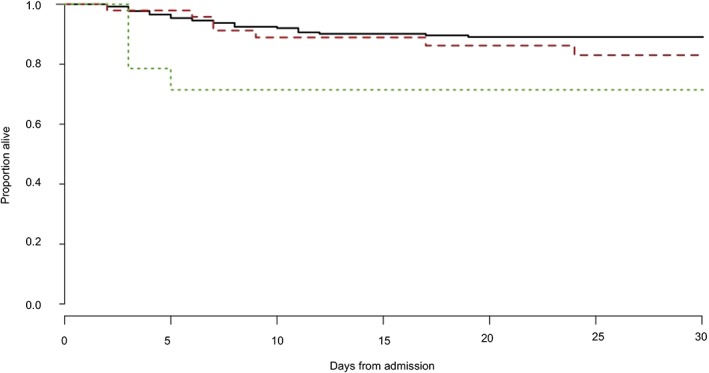
Figure 1.

Comparison of survival to discharge curves for horses with no kidney disease (S0) (black solid line), those that developed an acute kidney injury while hospitalized (S1‐S3) (red dashed line), and those that had azotemia on arrival (green dotted line) by the Kaplan‐Meier method (log‐rank test, P < .05)
