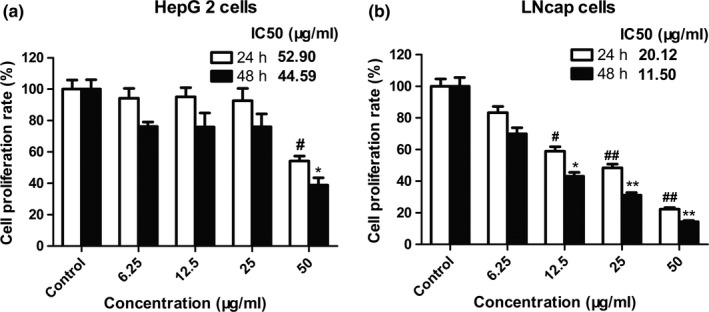
Figure 5.

Cell growth inhibition in HepG2 and LNcap cells PELS‐exposed. Cell proliferation is expressed as a percentage of the maximum value compared with the control cells (DMSO‐treated). Dose‐dependent decrease in values was higher in LNcap than in HepG2 cells. Each column refers to the mean ± SEM. n = 3. *p < .05 and ** p < .01 compared with corresponding DMSO‐treated control cells after 24 hr. #p < .05 and ## p < .01 compared with corresponding DMSO‐treated control exposed to 48 hr
