
Figure 2.
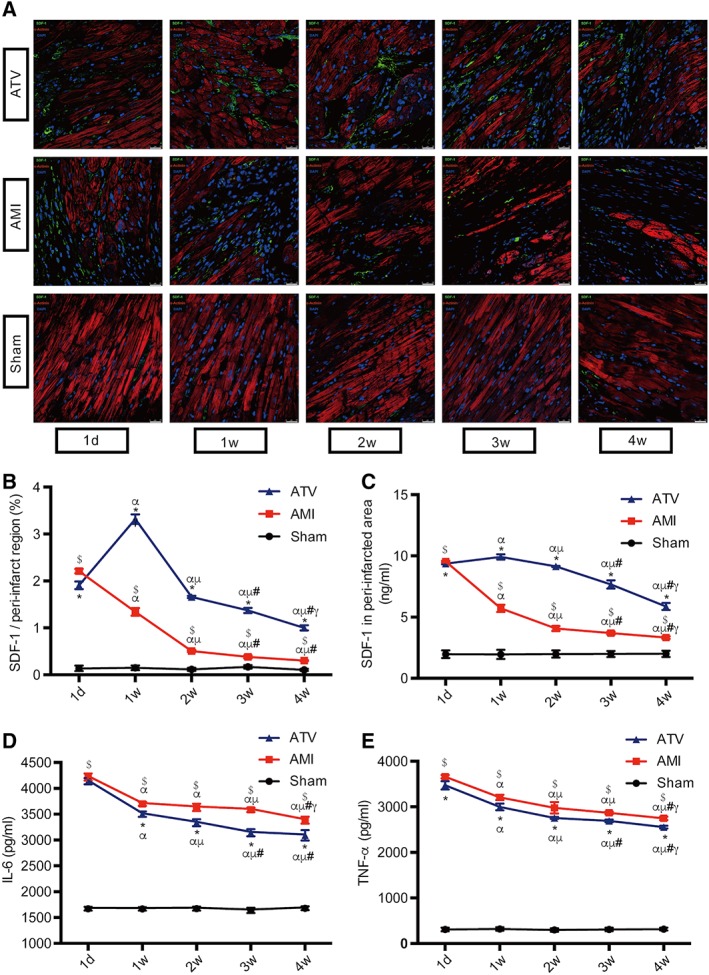
Changes of SDF‐1 expression and inflammation in peri‐infarcted region over the time course. (A): Representative immunofluorescence images of SDF‐1 in different groups at 1 day (d1), 1 week (d7), 2 weeks (d14), 3 weeks (d21), and 4 weeks (d28) post‐AMI. Cardiomyocytes, SDF‐1, α‐actinin, and nuclei were stained green, red, and blue, respectively. Scale bar = 25 μm. (B): Quantitative data of SDF‐1 immunofluorescence, described as the percentage of the area of SDF‐1 expression. (C–E): Enzyme Lined Immunosorbent Assay assessment of SDF‐1 expression, IL‐6, and TNF‐α in peri‐infarcted myocardium during the time course. n = 8–10 for each time point in each group. $ p < .05 vs. Sham group at each time point; *p < .05 vs. AMI group at each time point; α p < .05 vs. d1 time point in each group; μ p < .05 vs. d7 time point in each group; # p < .05 vs. d14 time point in each group; γ p < .05 vs. d21 time point in each group. All data are expressed as means ± SD. Abbreviations: AMI, acute myocardial infarction; ATV, atorvastatin; IL, interleukin; SDF, stromal cell‐derived factor; TNF, tumor necrosis factor.