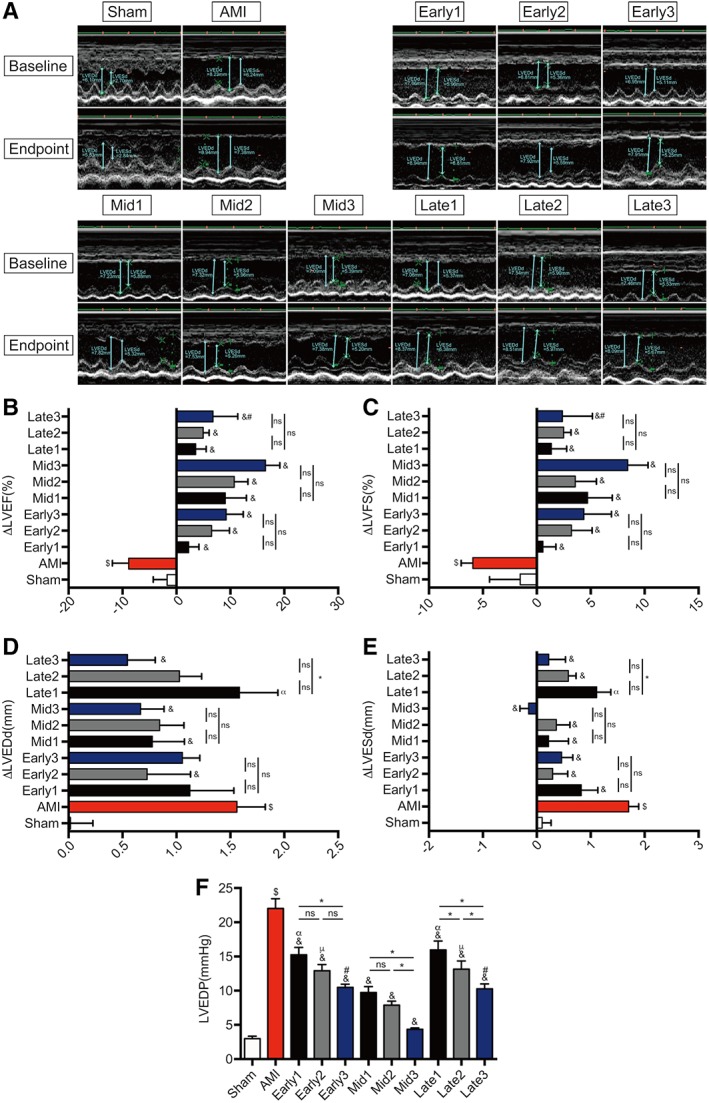
Figure 4.

Echocardiography and left heart catheterization assessment of cardiac function. (A): Representative images of M‐mode echocardiograms were shown at baseline (3 days after myocardial infarction) and endpoint (6 weeks after myocardial infarction). (B–E): The variation (=endpoint‐baseline) of left ventricular ejection fraction (ΔLVEF), left ventricular fractional shortening (ΔLVFS), left ventricular end‐diastolic dimension (ΔLVEDd), and left ventricular end‐systolic dimension (ΔLVESd). (F): The values of left ventricular end‐diastolic pressure (LVEDP. n = 8–11 for each group. $ p < .05 vs. Sham group; & p < .05 vs. AMI group; γ p < .05 vs. Early1; κ p < .05 vs. Early2; φ p < .05 vs. Early3; α p < .05 vs. Mid1; μ p < .05 vs. Mid2; # p < .05 vs. Mid3; *p < .05 intragroup comparison in different periods. All data are expressed as mean ± SD. Abbreviations: AMI, acute myocardial infarction; LVEDd, left ventricular end‐diastolic dimension; LVESd, left ventricular end‐systolic dimension; LVEF, left ventricular ejection fraction; LVFS, left ventricular fractional shortening.
