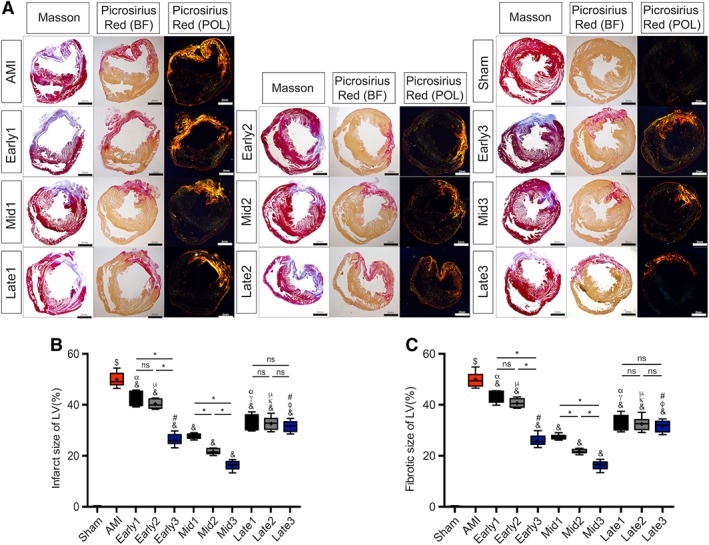
Figure 5.

Analyses of infarct size and fibrotic area. (A): Representative images for Masson's trichrome staining and picrosirius red staining at 6 weeks after myocardial infarction. In Masson, red, myocardium; blue, infarcted myocardium. In picrosirius red staining bright field (BF), red, Type I collagen fiber; yellow, normal myocardium. In picrosirius red staining polarization field (POL), bright orange, Type I collagen fiber. Scale bar = 2 mm. (B): Quantitative data for the left ventricular infarct size. (C): Quantitative data for the left ventricular fibrotic area. n = 8–11 for each group. $ p < .05 vs. Sham group; & p < .05 vs. AMI group; γ p < .05 vs. Early1; κ p < .05 vs. Early2; φ p < .05 vs. Early3; α p < .05 vs. Mid1; μ p < .05 vs. Mid2; # p < .05 vs. Mid3; *p < .05 intragroup comparison in different periods. All data are expressed as mean ± SD. Abbreviations: AMI, acute myocardial infarction; LV, left ventricular.
