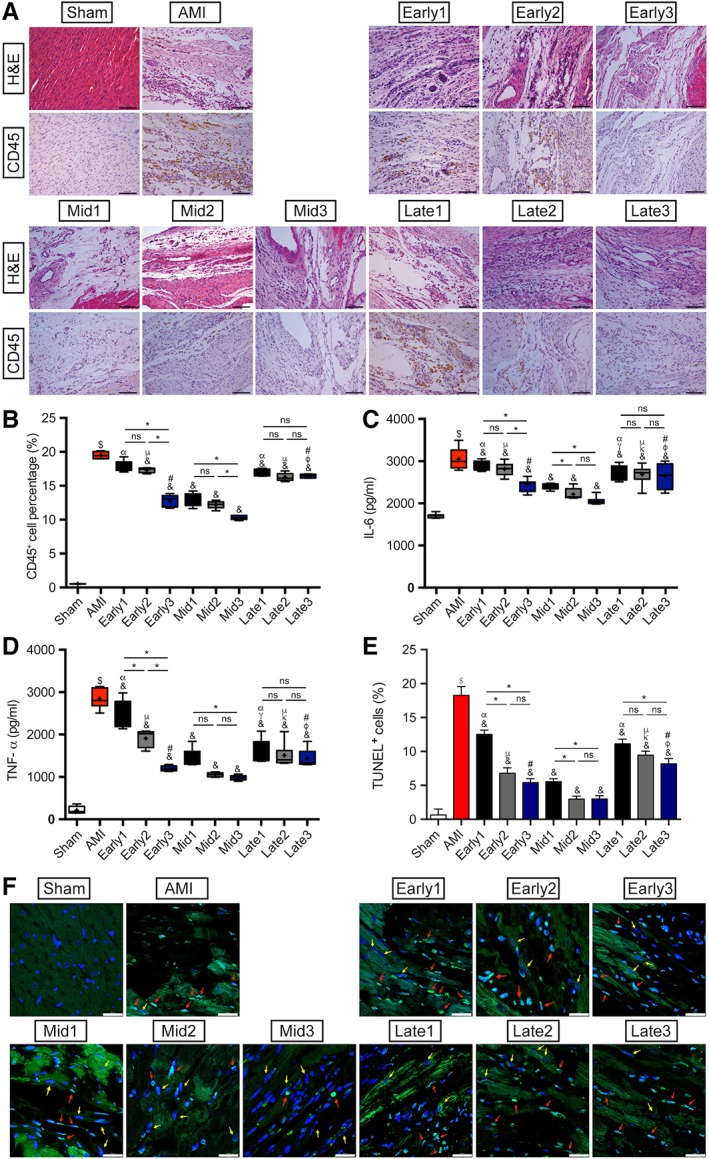
Figure 6.

Assessment of myocardial inflammation and cardiomyocytes apoptosis. (A): Representative images of H&E staining and CD45 immunohistochemistry in each group. Scale bar = 100 μm. (B): Quantitation of CD45+ inflammatory cells infiltration in the peri‐infarcted myocardium. n = 5 for each group. (C, D): ELISA assay results of IL‐6 and TNF‐α expressions in the peri‐infarcted myocardium in each group. n = 8 for each group. (E): Quantitative data for the ratio of apoptotic cells in each group. n = 5 for each group. (F): Representative images of TUNEL staining with autofluorescence of cardiomyocytes at 6 weeks after myocardial infarction in each group. Apoptotic cells were stained green and nuclei were blue, and the red arrows showed the apoptotic nuclei of cardiomyocytes whereas the yellow arrows were the normal cardiomyocytes nuclei. Scale bar = 25 μm. $ p < .05 vs. Sham group; & p < .05 vs. AMI group; γ p < .05 vs. Early1; κ p < .05 vs. Early2; φ p < .05 vs. Early3; α p < .05 vs. Mid1; μ p < .05 vs. Mid2; # p < .05 vs. Mid3; *p < .05 intragroup comparison in different periods. All data are expressed as mean ± SD. Abbreviations: AMI, acute myocardial infarction; IL, interleukin; TNF, tumor necrosis factor; TUNEL, terminal‐deoxynucleotidyl transferase‐mediated dUTP nick end labeling.
