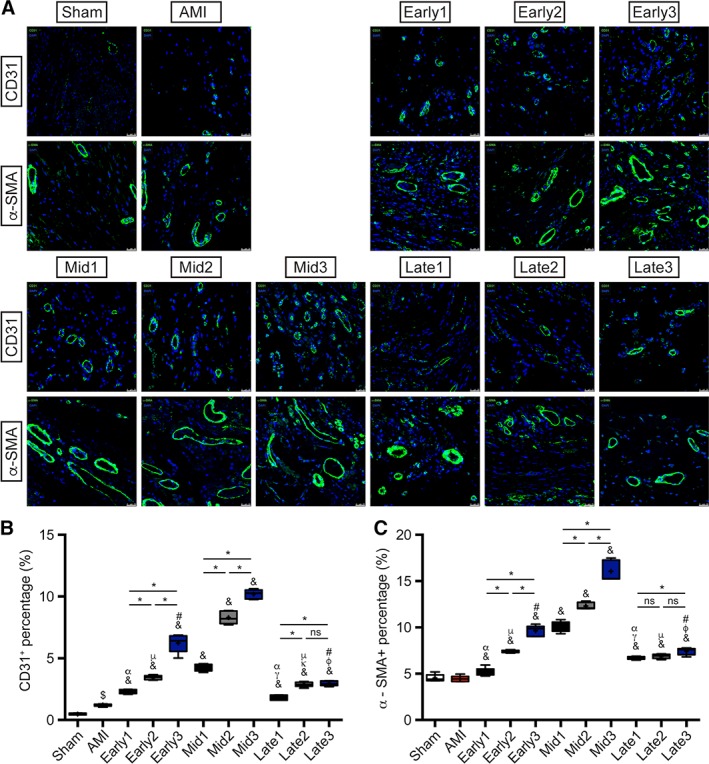
Figure 7.

Angiogenesis evaluated by α‐SMA and CD31 staining. (A): Representative images of α‐SMA and CD31 staining in peri‐infarcted region at the endpoint in each group. Vessels formation was stained green and nuclei were dyed with DAPI (blue). Scale bar = 25 μm. (B): Quantitative analyses of CD31 and (C) α‐SMA staining with vessel density per HPF in each group. n = 5 for each group. $ p < .05 vs. Sham group; & p < .05 vs. AMI group; γ p < .05 vs. Early1; κ p < .05 vs. Early2; φ p < .05 vs. Early3; α p < .05 vs. Mid1; μ p < .05 vs. Mid2; # p < .05 vs. Mid3; *p < .05 intragroup comparison in different periods. All data are expressed as mean ± SD. Abbreviations: α‐SMA, α‐smooth muscle actin; AMI, acute myocardial infarction.
