Figure 5.

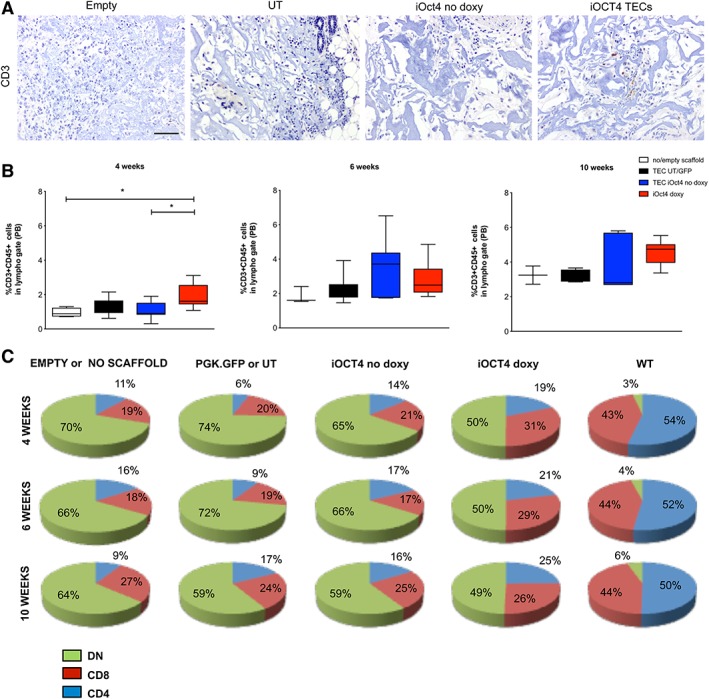
Thymic scaffolds generated with iOCT4 thymic epithelial cell (TEC) do not support clear thymopoiesis after implantation in athymic nude mice. (A): Two weeks after scaffold transplantation, ex vivo immunohistochemistry analysis of mice transplanted with scaffolds seeded with untransduced TEC (UT) or with lentiviral vector (LV) for Oct4 inducible expression (doxy or no doxy) was performed to detect thymocytes development by CD3 staining. Scale bar: 100 μm. (B, C): Peripheral blood analyses of mice transplanted with 3% 1,4‐butanediol diglycidyl ether collagen type I scaffolds seeded with 60,000–400,000 of UT, LV PGK.GFP, or with LV iOct4‐transduced TEC cultured in the presence or absence of doxycycline at different time points after subcutaneously in vivo transplantation (mean of four experiments). In (B), the graphs summarize the frequency of CD45+CD3+ cells in different groups of animals at indicated time points (one‐way analysis of variance with Dunn's multiple comparison test. At 4 weeks: iOCT4 TEC scaffolds n = 13; UT/PGK.GFP scaffolds n = 9; TECs no doxy scaffolds n = 9; empty/no scaffold n = 4, p = .0083. At 6 weeks: iOCT4 TECs‐scaffolds n = 11; UT/PGK.GFP scaffolds n = 7; TECs no doxy scaffolds n = 8; empty/no scaffolds n = 3, p = .1216. At 10 weeks: iOCT4 TECs‐scaffolds n = 9; UT/PGK.GFP scaffolds n = 5; TECs no doxy scaffolds n = 5; empty or no scaffolds n = 2, p = .1854). In (C), the frequency of CD4+, CD8+, and DN cell of the same groups of animals 4, 6, and 10 weeks after transplantation are reported as pie charts.
