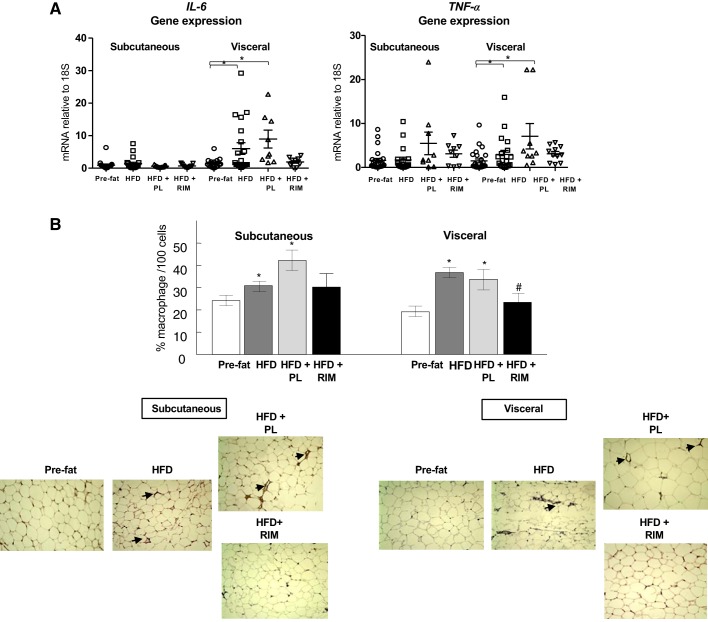
Fig. 6.
A: IL-6 and TNFα gene expression in the subcutaneous and visceral adipose tissue. P values vs. pre-fat period (*P < 0.05) and vs. high-fat diet (HFD) (#P < 0.05). Placebo (PL), n = 9; rimonabant (RIM), n = 11. Data are means ± SE. B: effect of RIM on CD68-positive (% macrophages per 100 cells) adipocytes (PL, n = 9; RIM, n = 11). Representative Immunohistochemistry images of CD68 protein in the SC and VIS depot. P values vs. pre-fat period (*P < 0.05) and vs. HFD (#P < 0.05). Data are means ± SE.

