Fig. 6.
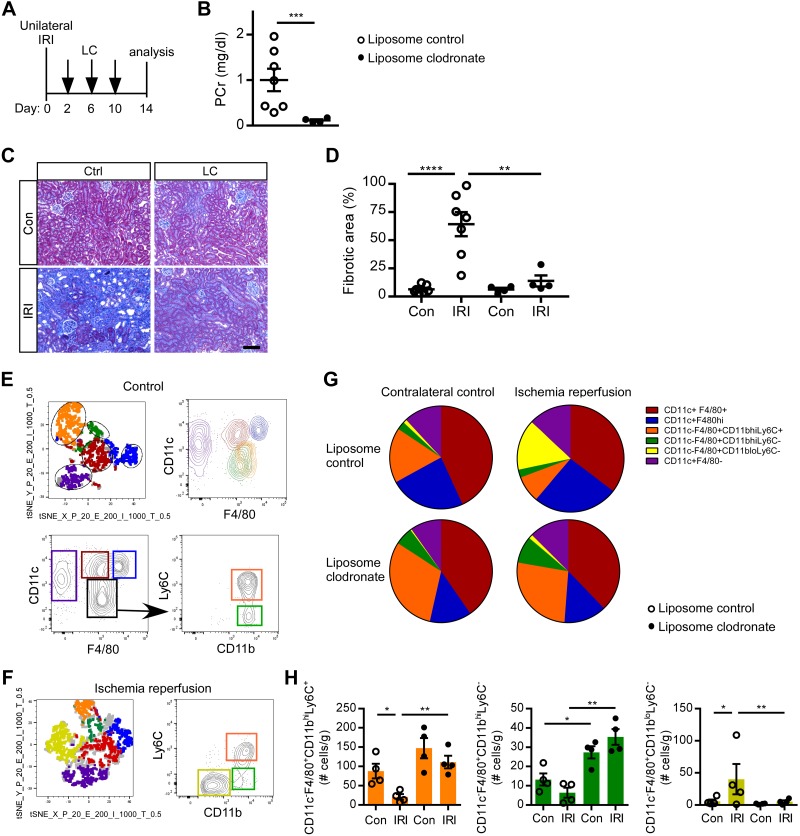
Deletion of macrophages rescues kidney function and reduces fibrosis in Foxd1Cre CD73fl/fl mice. A: Foxd1Cre CD73fl/fl mice were administered control liposomes (Ctrl; n = 7) or liposome clodronate (LC; n = 4) on days 2, 6, and 8 after unilateral ischemia-reperfusion injury (IRI). B: on day 14, kidney function was evaluated by measuring plasma creatinine (PCr). C and D: kidney fibrosis (collagen deposition) as revealed by Masson’s trichrome (representative images; C) was quantified in contralateral control (Con) and IRI kidneys (fibrotic area expressed as a percentage of the kidney tissue surface area occupied by blue trichrome stain; D). E−H: flow cytometry analysis. Samples were pregated on live, CD45+, singlet, Ly6G−, and CD11b+ cells. E: T-distributed stochastic neighbor embedding (tSNE) plot (top left) of concatenated samples from an unoperated control kidney in the liposome control group of CD73fl/fl mice. Gates were drawn on the five different groups and applied to the CD11c by F4/80 plot (top right) to determine myeloid populations by surface phenotype in an unbiased manner. Bottom plots show the gating strategy as determined by tSNE analysis. Colored gates were then applied back on the tSNE plot, demonstrating the gating strategy corresponds with the five clusters. F: representative tSNE plot and CD11clo F4/80+ population (black gate) further gated for Ly6C and Cd11b and displaying an additional population (yellow) in liposome control-treated IRI kidneys of Foxd1Cre CD73fl/fl mice. G and H: pie chart (G) and quantification (H) of myeloid populations from IRI and contralateral control kidneys of liposome control- and LC-treated Foxd1Cre CD73fl/fl mice. *P < 0.05, **P < 0.01, and ****P < 0.0001 by an unpaired t-test (B) or two-way ANOVA (D and H). Scale bar = 100 µm.

