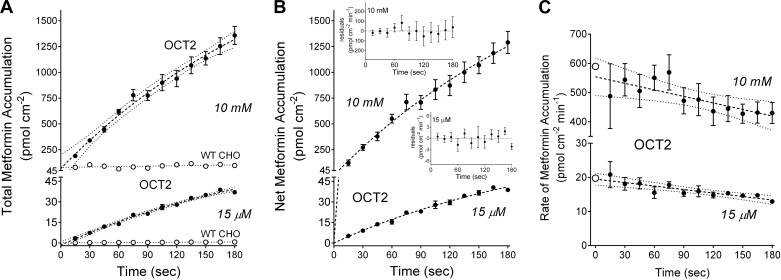
Fig. 1.
A: time course of net accumulation of two concentrations of [14C]metformin (15 µM and 10 mM) into organic cation transporter 2 (OCT2)-expressing Chinese hamster ovary (CHO) cells (solid symbols) and wild-type (WT; nonexpressing) CHO cells (open symbols). Each point is the mean ± SE of uptakes determined sequentially in three 96-well plates (n = 3) and represents a single experiment. The dashed lines were fit to the OCT2 data using an exponential rise to a constant (showing 95% confidence intervals); the dotted lines were fit to the WT CHO cell data using simple linear regression. B: time course of net accumulation of 15 µM and 10 mM metformin into OCT2 cells, corrected for plate background as discussed in the text. Dashed lines were fit to the data using Eq. 1. The residuals for each time course are shown in the insets. C: calculated rates (per minute) of OCT2-dependent metformin transport, determined from net accumulation at each measured point of the time courses shown in B. Each solid point is the mean transport rate ± SE calculated from uptakes measured in three wells. The dashed lines represent simple linear regressions of the data as plotted. The open symbols at time 0 represent the rates of metformin transport at time 0 calculated using extrapolated maximum accumulation (Umax) and fitted constant (KU) values determined with Eq. 1.

