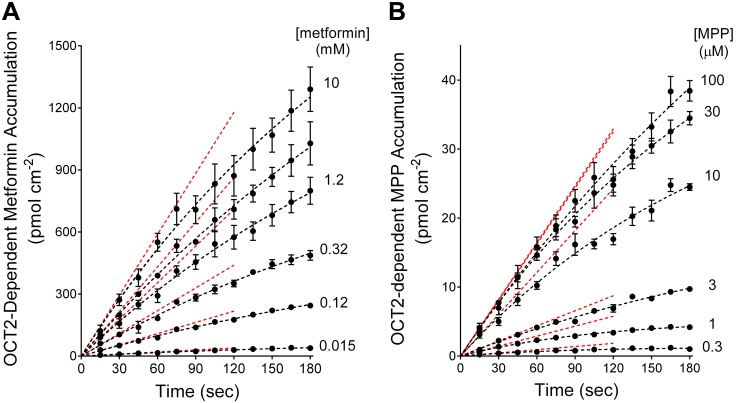
Fig. 3.
Time courses of net accumulation of six concentrations of [14C]metformin (A) or [3H]1-methyl-4-phenylpyridinium (MPP; B) into organic cation transporter 2 (OCT2)-expressing Chinese hamster ovary cells. Each time course was corrected for background uptake, as described in the text and in Figs. 1 and 2. Each point is the mean ± SE of uptakes determined sequentially in three 96-well plates (n = 3) and reflects results of single representative experiments. The dashed black lines were fit to these data using Eq. 1. The dashed red lines indicate the slopes at time 0 (initial rate) calculated using the extrapolated maximum accumulation (Umax) and fitted constant (KU) values obtained with Eq. 1.

