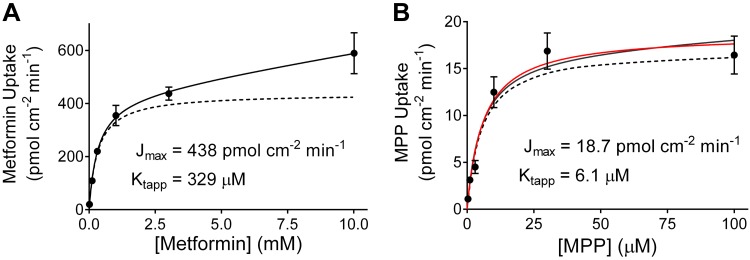
Fig. 4.
A: kinetics of organic cation transporter 2 (OCT2)-mediated metformin transport. Solid symbols represent mean ± SE rates of total metformin uptake by OCT2-expressing Chinese hamster ovary (CHO) cells calculated using the data shown in Fig. 3A. The solid line was fit to these data using Eq. 2 and reflects the combined influence of OCT2 and a nonsaturable (first-order) process (dominated by extracellular substrate not removed by the rinsing procedure). The dashed line was calculated using maximum rate of mediated substrate transport (Jmax) and apparent Michaelis constant (Ktapp) values determined from Eq. 2. B: kinetics of OCT2-mediated 1-methyl-4-phenylpyridinium (MPP) transport. Solid symbols represent mean ± SE rates of total MPP uptake by OCT2-expressing CHO cells calculated using the data shown in Fig. 3B. The solid black line was fit to these data using Eq. 2 and reflects the combined influence of OCT2 and a nonsaturable (first-order) process. Note that the nonsaturable (nonmediated) component of total net substrate accumulation (kaccum) value used in this analysis was set equal to the kaccum value calculated from the metformin data in Fig. 4A, and the dashed black line was calculated using Jmax and Ktapp values determined from this analysis. The solid red line was fit to the data using just the Michaelis-Menten equation (i.e., with no first-order component). The resulting kinetic values (listed in the figure) were not statistically different from those obtained with Eq. 2 (using the metformin kaccum value).

