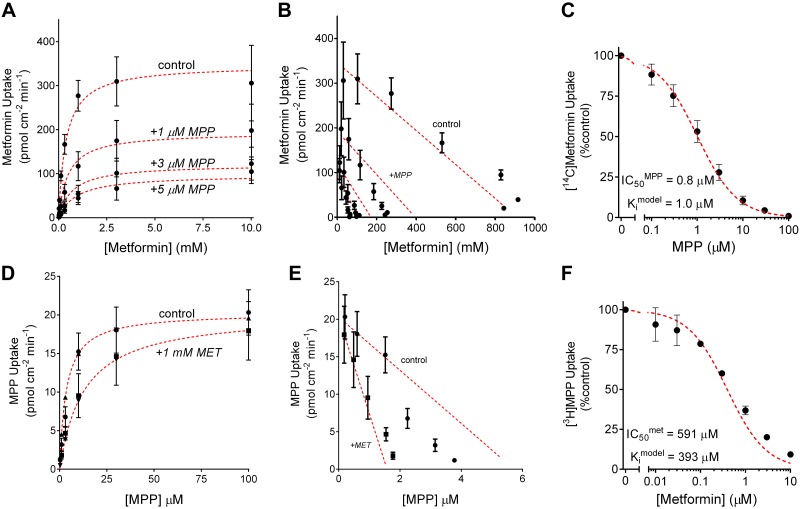
Fig. A2.
Model III-based descriptions of the kinetic interactions of metformin and 1-methyl-4-phenylpyridinium (MPP) with organic cation transporter 2 (OCT2). The solid points (with associated error bars) show experimental data previously presented: data from Fig. 8A (A), data from Fig. 8B (B), data from Fig. 5B (C), data from Fig. 6A (D), data from Fig. 6B (E), and data from Fig. 5A (F). The red dashed lines show the predicted kinetic profiles derived from optimizing model III to the transport profiles shown in A and D.

