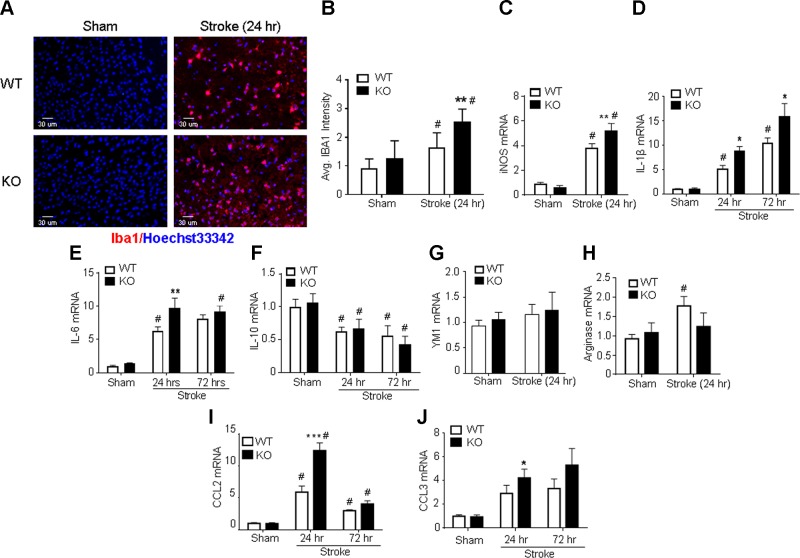
Figure 4.
GPR37 deficiency exacerbates microglial activation and inflammation in the poststroke brain. Immunohistochemical staining and RT-PCR were utilized to examine microglial activation and inflammatory factors in the poststroke brain. A, B) Immunostaining of Iba1-positive cells in brain tissue from WT and GPR37 KO mice. No differences were observed in Iba1-positive cells in uninjured cortex. Ischemic insults increased the numbers of microglia and macrophages (Iba1-positive cells) in the ischemic cortex 24 h after stroke, and even more Iba1-positive cells were seen in GPR37 KO mice. Quantified data are shown in the bar graph [2-way ANOVA; F (1,26) = 33.06; n = 8 independent assays]. **P < 0.001 vs. WT control, #P < 0.05 vs. sham-treated controls. C–E) M1 microglia markers were measured using RT-PCR. Ischemic insults increased the M1 markers iNOS, IL-1β, and IL-6 mRNA in both WT and GPR37 KO brains. Significantly greater increases in iNOS expression occurred in GPR37 KO mice [2-way ANOVA; F (1,23) = 199.3; n = 8 for sham-treated controls; n = 6 for stroke groups (C)] **P < 0.01 vs. WT stroke control, #P < 0.05 vs. sham controls. IL-1β mRNA increased at 24 and 72 h after stroke, with greater increases being seen in GPR37 KO mice at both time points [2-way ANOVA; F (2,8) = 48.89; n = 3 (D)]. *P < 0.05 vs. WT stroke control, #P < 0.05 vs. sham-treated control. Another M1 marker, IL-6, showed a similar expression pattern in the poststroke brain [F (2,6) = 45.51; n = 3 (E)]. **P < 0.01 vs. WT stroke control, #P < 0.05 vs. sham-treated control. F–H) Quantified analysis of mRNA levels showed similar reductions of the M2 cell marker IL-10 in both WT and GPR37 KO brains [2-way ANOVA; F (2,8) = 11.56; n = 3 (F)]. #P < 0.05 vs. sham-treated control. The M2 marker YM1 was not significantly changed after stroke in both strains [2-way ANOVA; n = 3 (G)]. Stroke increased the M2 marker arginase in WT mice but not in GPR37 KO mice [2-way ANOVA; F (1,23) = 4.431; n = 8 (H)]. #P < 0.05 vs. sham control. I, J) Ischemic insults showed time-dependent increases in expression of the inflammatory factors CCL2 and CCL3. At 24 h after stroke, larger increases in CCL2 expression were seen in GPR37 KO mice. These increases subsided at 72 h after stroke [2-way ANOVA; F (2,6) = 47.03 (I)]. ***P < 0.001 vs. WT, #P < 0.05 vs. sham-treateed controls. CCL3 mRNA was enhanced in the ischemic cortex in both WT and GPR37 KO mice, and there was a larger increase in the GPR37 KO cortex compared with WT stroke control at 24 h after stroke [2-way ANOVA; F (2,8) = 11.4; n = 3 (J)]. *P < 0.05 vs. WT stroke control, #P < 0.05 vs. sham-treated controls. Avg, average.

