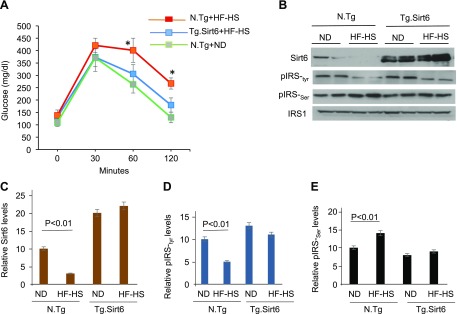
Figure 6.
Tg.Sirt6 mice are protected from developing insulin resistance. A) Glucose tolerance test was carried out in different groups of mice. Values are means ± se; n = 5. *P < 0.01. B) Western analysis of the heart lysate of different groups of mice. C–E) Quantitation of the Western blots. Mean ± se; n = 3. ND, normal diet.

