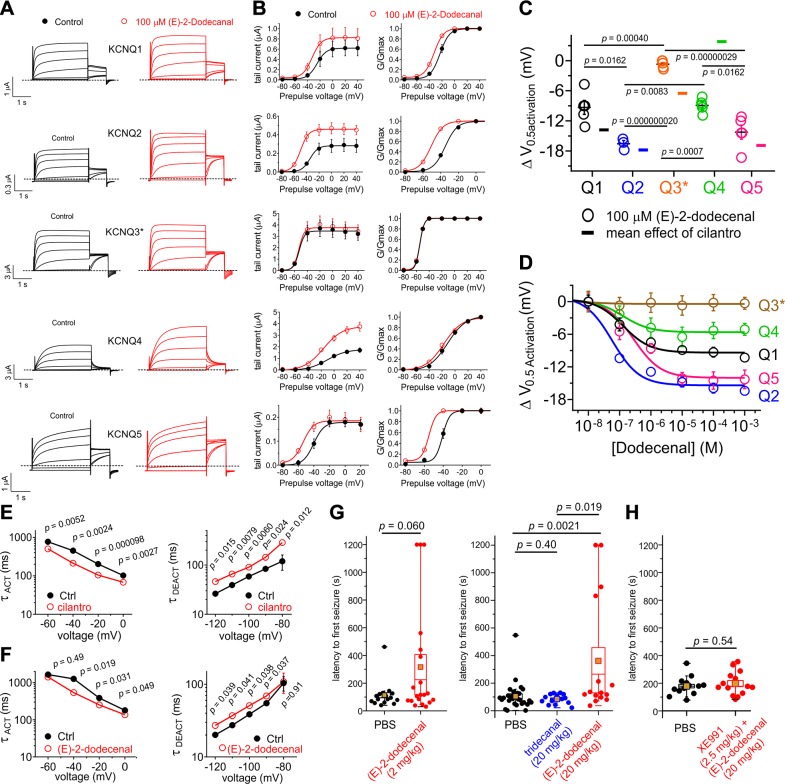
Figure 4.
(E)-2-dodecenal and cilantro extract exhibit similar KCNQ isoform selectivity and anticonvulsant effects. All error bars indicate sem. A) Mean TEVC current traces showing effects of (E)-2-dodecenal (100 µM) on homomeric KCNQ channels expressed in Xenopus oocytes; n = 5 except for KCNQ2 (n = 3). B) Mean tail current (left) and normalized tail currents (G/Gmax) (right) vs. prepulse voltage relationships for the traces as in A; n = 5 except for KCNQ2 (n = 3). C) Mean ΔV0.5 activation induced by (E)-2-dodecenal (100 µM) (scatter plot) vs. mean effects of 1% cilantro extract (single bars indicate means from Figs. 1 and 2) for the homomeric KCNQ isoforms indicated; n = 5 except for KCNQ2 (n = 3). D) (E)-2-dodecenal dose responses for homomeric KCNQ1–5 channels (n = 3–5). E, F) Comparison of effects of 1% cilantro extract (E) vs. (E)-2-dodecenal (100 µM) (F) on KCNQ2/3 activation and deactivation rate vs. voltage; n = 6. G) Mean latency to first PTZ-induced seizure for mice preinjected with PBS (n = 16) vs. (E)-2-dodecenal (2 mg/kg) (n = 20) (left) or PBS (n = 29) vs. tridecanal (20 mg/kg) (n = 15) or (E)-2-dodecenal (20 mg/kg) (n = 15) (right). Statistical analysis was by 2-way ANOVA corrected for multiple comparisons. Gold squares = mean values. H) Mean latency to first PTZ-induced seizure for mice preinjected with PBS (n = 14) or 20 mg/kg (E)-2-dodecenal + 2.5 mg/kg XE991 (n = 13). Statistical analysis was by 2-way ANOVA.

