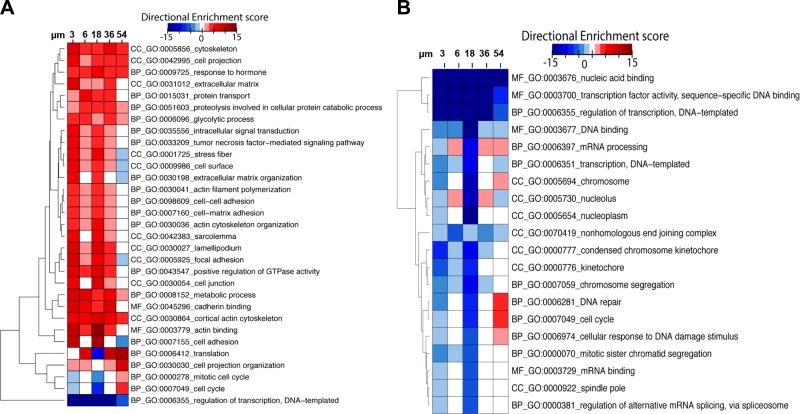
Figure 6.
Interfiber spacing modulates gene expression. A) Hierarchical clustering and gene ontology (GO) enrichment analysis of gene families related to cellular phenotypes in cells cultured on fiber networks of different interfiber spacing. B) Hierarchical clustering and GO enrichment analysis of gene families primarily down-regulated during growth on fiber networks. Down-regulated networks are primarily associated with transcription. Directional enrichment scores are reported with respect to flat 2D control. BP, biological process; CC, cellular component; MF, molecular function.

