Figure 2.
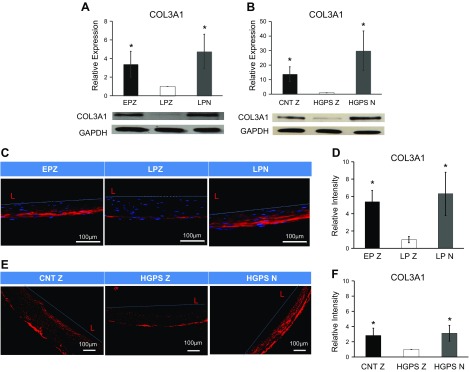
Ectopic expression of NANOG in senescent hMSCs and HGPS fibroblasts restore COL3 expression in 2-dimensional and 3-dimensional model. A, B) Western blotting analysis and quantification for COL3 in EP+ZsGreen (EPZ), LPZ, and LPN hMSCs (A) as well as in CNT+ZsGreen (CNTZ), HGPS+ZsGreen (HGPSZ), and HGPS+NANOG (HGPSN) fibroblasts (B). To prepare tissue constructs, cells were introduced into fibrin hydrogels that were allowed to polymerize around mandrels. C–F) Immunostaining and quantification of engineered tissues of EPZ, LPZ, and LPN hMSCs (C, D) and CNTZ, HGPSZ, and HGPSN fibroblasts (E, F). EPZ, Early passage (6, 7); LPN/LPZ, late passage (13–16). One microgram per milliliter DOX was added in the medium to express NANOG or ZsGreen. Data are compared to LPZ (A, D) or HGPSZ (B, F) and presented as means ± sd, n = 3 independent experiments. *P < 0.05 compared to LPZ or HGPSZ (n = 3 independent experiments).

