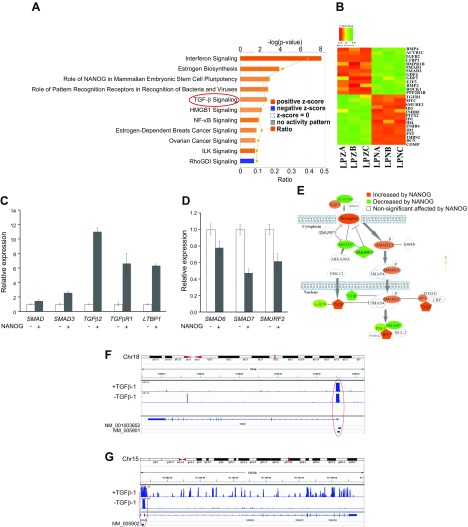
Figure 3.
TGF-β is highly activated by NANOG expression in senescent hMSCs. A) Bar chart represents the top canonical signaling pathways that were affected by NANOG. Red bar represents positively affected pathways, and the blue bar represents negatively affected pathways. P values were determined using Fisher’s exact test with a threshold value of P = 0.05. Ratios represent the number of genes that mapped to a specific canonical pathway divided by the total number of genes that make up the respective pathway. Pathways with z score >2 were selected. B) Heat map of RNA-Seq for TGF-β associated genes in control (LPZ) vs. NANOG-expressing (LPN) cells. C, D) Validation of RNA-Seq through real-time PCR. E) Activation of the canonical TGF-β pathway. The red symbols represent up‐regulated genes, and the green symbols represent down-regulated genes, with the intensity of node color indicating a degree of up- and/or down‐regulation. White symbols indicate genes that do not appear on the list and the shape of each node denotes the function of the gene product. An alignment search of the promoter sequence of SMAD2 (F) or SMAD3 (G) using ChIP-Seq result shows that NANOG directly binds to SMADs promoter in the presence or absence of TGF-β. NM number denotes SMAD2/SMAD3 mRNA in RefSeq (NCBI Reference Sequences) records. Data range of 4–50 is filtered. Cells were treated with TGF-β (2 ng/ml) for 3 d and 1 µg/ml DOX was added in the medium throughout the experiment. *P < 0.05 compared to LPZ hMSCs (n = 3 independent experiments).

