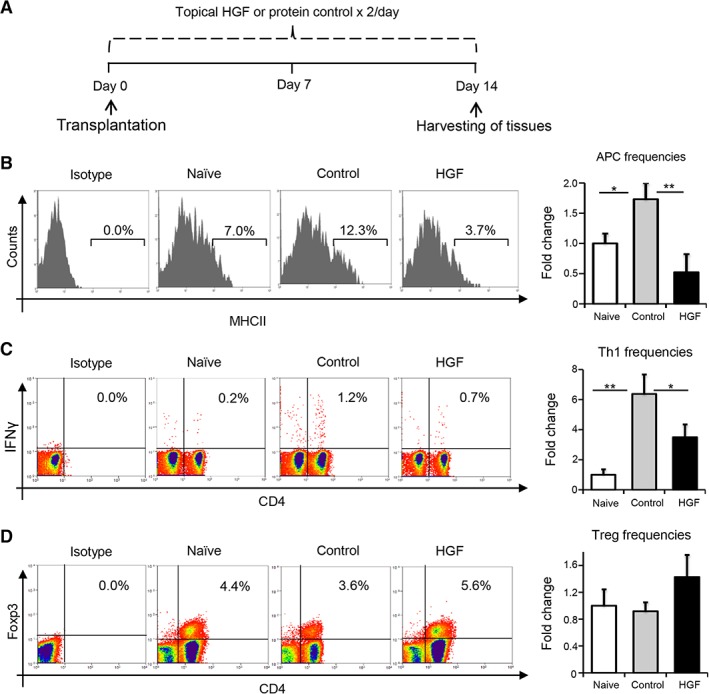
Figure 4.

HGF treatment suppresses induction of alloimmunity in transplant recipients. (A): Schematic of experiment detailing the time points of topical administration of HGF (0.1%) or protein control twice daily for 2 weeks post‐transplantation. Following week 2, ipsilateral draining lymph nodes were harvested to prepare single cells suspension for flow cytometry analysis. (B): Representative flow cytometric histograms (left) and cumulative bar chart (right) showing the relative frequencies of CD11c+MHCII+ mature APCs in the draining lymph nodes of naïve, control‐treated, and HGF‐treated groups at 2 weeks post‐transplantation. (C): Representative flow cytometric dot plots (left) and quantification chart (right) of frequencies of IFNγ+CD4+ Th1 cells in the draining lymph nodes of naive, protein control, and HGF‐treated groups at 2 weeks post‐transplantation. (D): Representative flow cytometric analysis (left) and cumulative bar chart (right) showing the relative frequencies of CD4+Foxp3+ Tregs in the draining lymph nodes of naïve, control‐treated, and HGF‐treated groups at 2 weeks post‐transplantation. Representative data from four independent experiments are shown, and each experiment consisted of four to six animals. Data are represented as mean ± SD (error bar). t test: *, p < .05; **, p < .01. Abbreviations: APC, antigen presenting cell; HGF, hepatocyte growth factor.
