Figure 1.

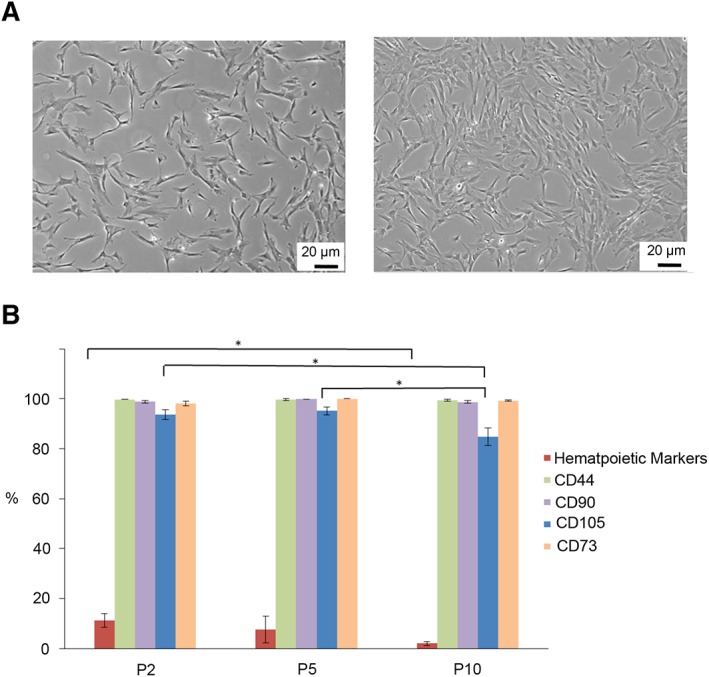
Immunophenotypic analysis of cord tissue (CT)‐mesenchymal stromal cells (MSCs). MSCs from multiple donors were analyzed at three different passages: passage 2 (n = 40), passage 5 (n = 20), and passage 10 (n = 20) to determine their MSC profile. (A): The cells migrate from the piece of CT and have the typical MSCs shape. As the cells reach confluence, they become aligned and elongated. (B): The percentage of cells expressing CD73, CD44, and CD90 remained consistent throughout the 10 passages, whereas the percentage of cells expressing CD105 declined after passage 5. Statistically significant differences are denoted by * (p < .05).
