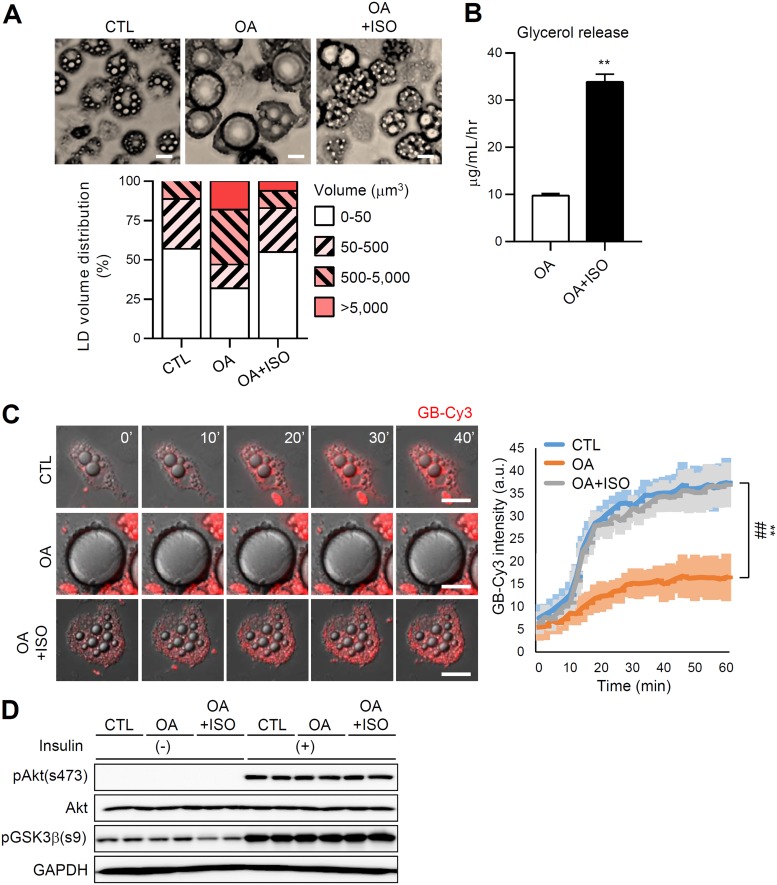
FIG 2.
LD configuration is associated with insulin-dependent glucose uptake ability during adipocyte remodeling. Differentiated 3T3-L1 adipocytes were cultured for 6 days with oleic acid (OA; 500 μM) followed by isoproterenol (ISO, 2 μM, 12 h). CTL denotes control (BSA + DMSO). (A) Microscopic images of adipocytes with different LD locularities (top). Scale bar, 25 μm. A quantification of the LD volume (bottom) is also shown. (B) Glycerol release. Data represent means ± the SD. **, P < 0.01 (Student t test). (C) Insulin-dependent GB-Cy3 (5 μM, red) uptake assay. The fluorescence intensities of GB-Cy3 were monitored after stimulation with insulin (100 nM) using Deltavision time-lapse imaging (left) and quantified using ImageJ (right). Scale bars, 25 μm. Data represent means ± the SD. **, P < 0.01 (CTL versus OA) and ##, P < 0.01 (CTL versus OA+ISO), determined using two-way ANOVA with the Bonferroni post hoc test. (D) Immunoblot of insulin signaling cascade in adipocytes with or without insulin (10 nM, 30 min).

