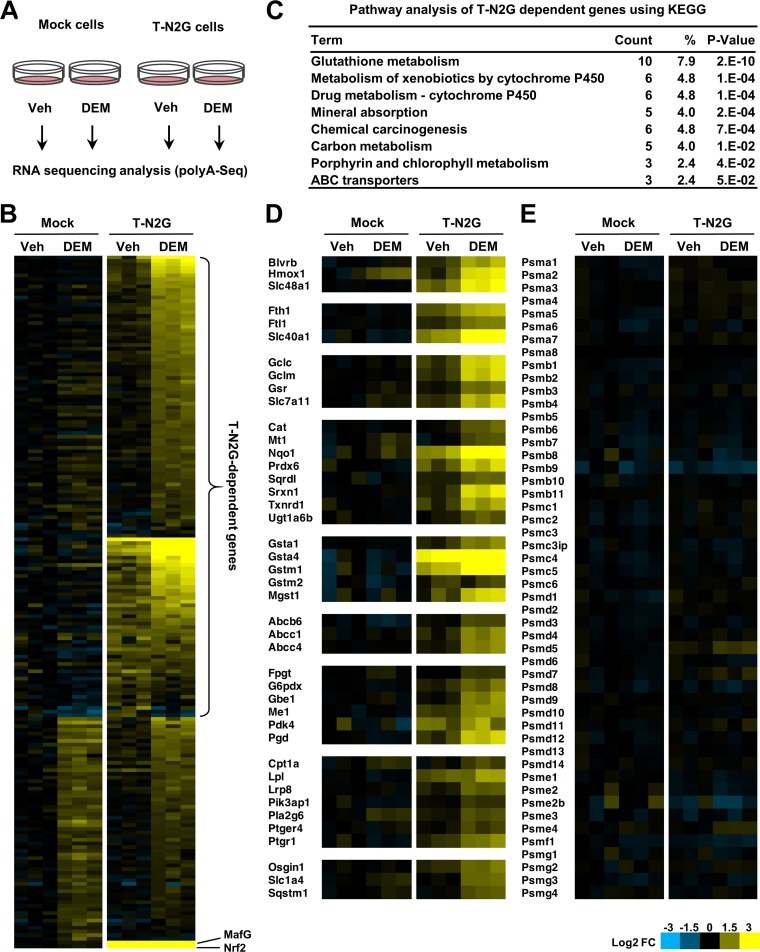
FIG 5.
T-N2G activates a wide range of Nrf2 target genes. (A) Schematic diagram of the protocol for RNA-Seq. RNA was extracted from the mock and T-N2G cells treated with 100 μM DEM or the vehicle (Veh) for 12 h and subjected to RNA-Seq. (B) Heatmap of relative expression levels of genes whose expression was significantly induced by DEM in T-N2G cells and genes whose basal expression in T-N2G cells was significantly higher than that in mock cells (false discovery rate [FDR] < 0.05, log2 fold change [FC] > 0.7). Genes whose expression was induced by DEM, even in mock cells, are regarded as T-N2G-independent genes. The expression levels of MafG and Nrf2, shown at the bottom, are derived from the T-N2G vector. (C) Pathway analysis of T-N2G-dependent genes using KEGG data sets. Count represents the number of genes involved in each pathway, and the percent represents the percentage of genes involved in the total genes in each pathway. P values represent modified Fisher’s exact P values. (D) Heatmap of relative expression levels of genes induced in a T-N2G-dependent manner. Genes are categorized into groups based on their functions. (E) Heatmap of relative expression levels of proteasome subunit genes. Heatmap colors indicate the log2 FC values relative to the median expression level of each gene in mock cells without DEM treatment (B, D, and E).

