
Fig. 6.
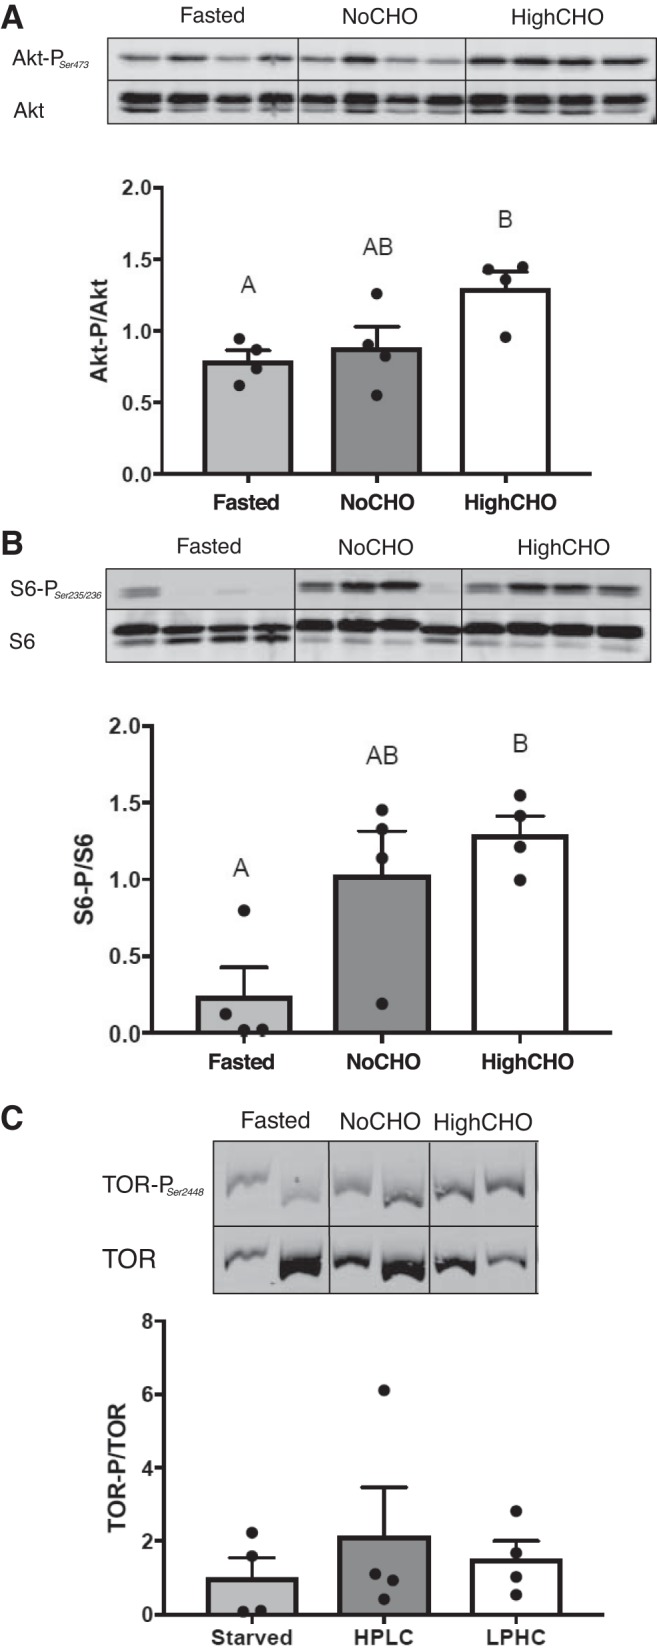
Hepatic insulin signaling pathway activity assessed by ratios of phosphorylated and total protein (+SE) of Akt (A), S6 (B), and Tor (C) based on densitometry-based quantification of four samples per group by Western blots. In cases where data were normally distributed and met the criteria of homoscedasticity, a one-way ANOVA followed by Tukey’s post hoc was used for analysis, whereas a Kruskal-Wallis test followed by Dunn’s multiple comparisons test was used in cases where data did not meet these criteria. A P value of P < 0.05 was used as cut-off for significant effects.