Fig. 1.
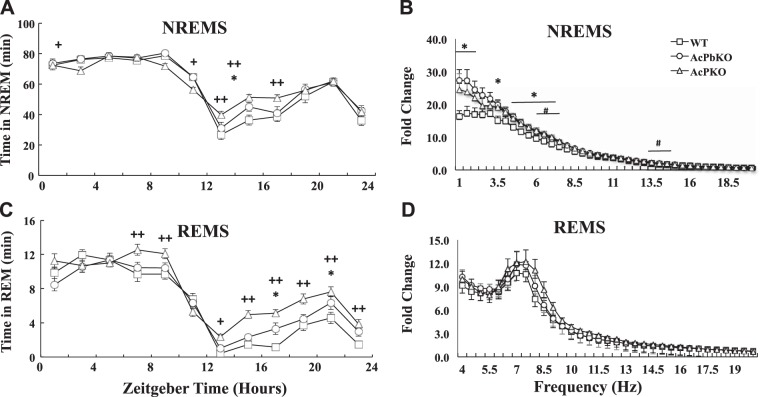
Interleukin-1 receptor accessory protein (AcP) knockout (KO) mice have distinct baseline sleep and electroencephalogram (EEG) power spectra compared with wild-type (WT) or brain-specific AcP (AcPb) KO mice. Time spent in non-rapid eye movement sleep (NREMS), during baseline recordings (A) and time spent in rapid eye movement sleep (REMS) (C) are different between strains throughout the dark period [zeitgeber time (ZT)12–ZT24] (*P < 0.05 WT vs. AcPb KO; +P < 0.05, ++P < 0.01 WT vs. AcP KO). NREMS EEG spectral power (1–20 Hz) (B) and REMS EEG spectral power (4–20 Hz) (D) during light period (ZT0–ZT12) in AcPb KO (○), AcP KO (Δ), and WT (□) mice. Data (B and D) are fold changes from power in the (17–17.5 Hz) frequency bin; in this frequency bin, absolute power from all 3 strains was very close (*P < 0.05, AcPb KO vs. WT mice; #P < 0.05, AcP KO vs. WT). Graphs show means ± SE.

