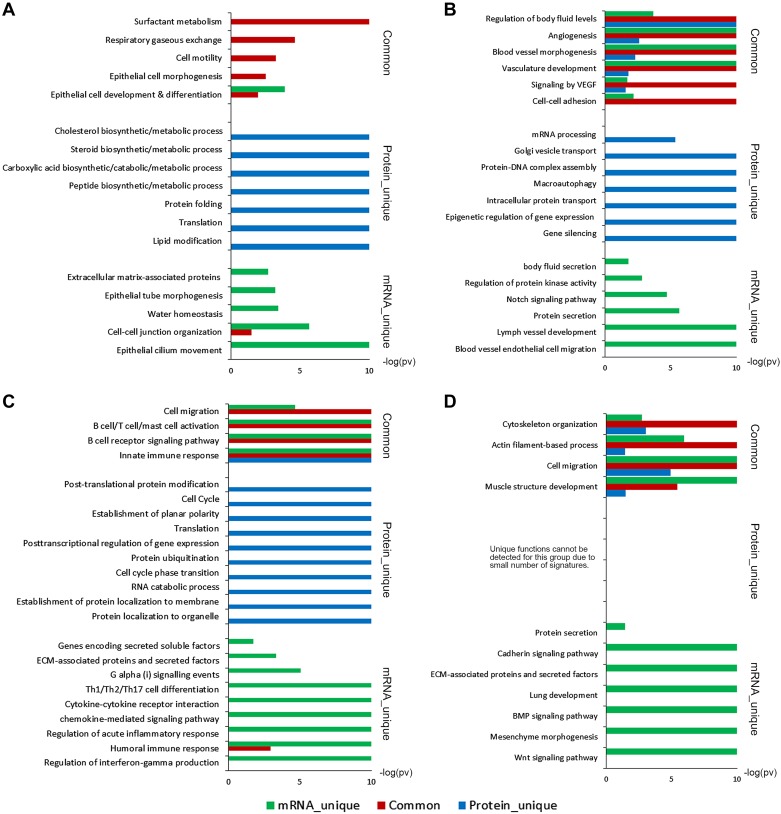
Fig. 4.
Gene set enrichment analyses predicted enriched functions for coherently and noncoherently expressed mRNA-protein pairs of each cell type. Functional enrichment analysis predicted enriched bio-processes and pathways of epithelial cells (A), endothelial cells (B), immune cells (C), and mesenchymal cells (D), which are commonly or independently regulated at mRNA and protein levels. The x-axis represents the –log10 transformed enrichment P value.

