Fig. 5.
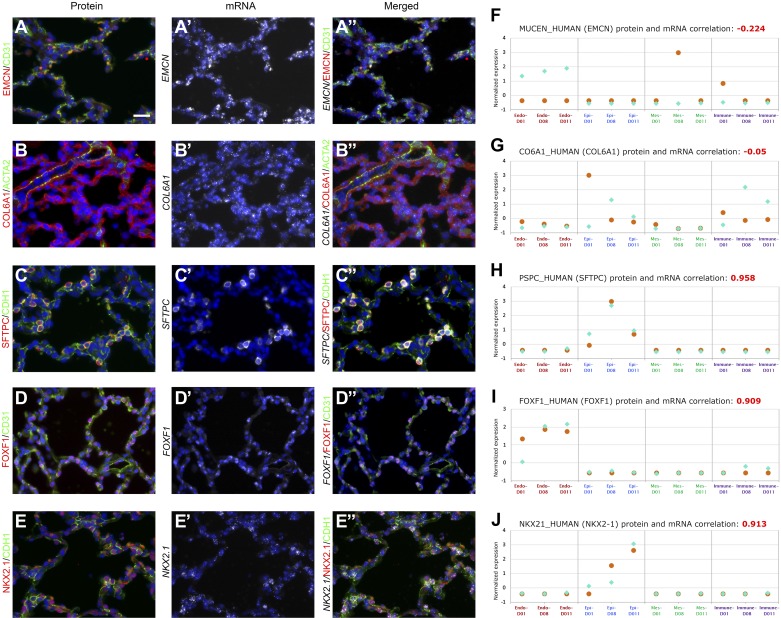
Correlation between immunofluorescence staining and RNA expression patterns. Protein and RNA localization was assessed in lung sections from infants of 20 mo of age by coimmunofluorescence antibody and in situ hybridization staining with RNAscope. A–E: indicated proteins are shown in red and costaining cell-specific markers CD31 (endothelial), CDH1 (epithelial), or ACTA2 (smooth muscle myofibroblasts) are shown in green. A’–E’: indicated RNA is shown in white, performed simultaneously on the same sections. A”–E”: combination of coimmunofluorescent staining of proteins (red/green) and RNA expression (white) are shown. Scale bars, 25 μm. F–J: abundance of each RNA and protein in each cell type and their correlation (red). Correlation was calculated using the Pearson correlation coefficient.

