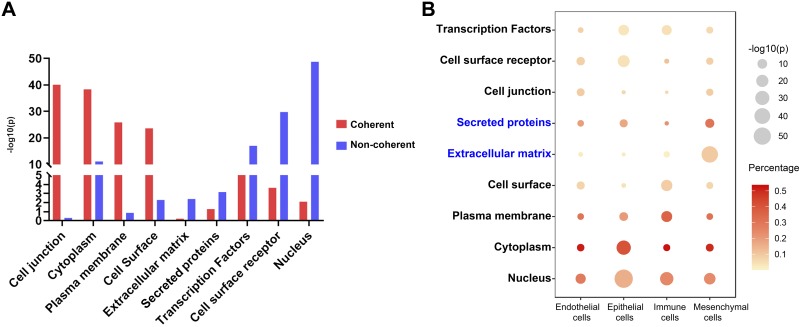
Fig. 6.
Analyses of potential factors influencing mRNA and protein expression coherency. A: bar graph showing the significance of potential factors influencing coherently (n = 765) and noncoherently expressed mRNA-protein pairs (n = 6276) using chi-square test. P values are in –log10 transformed. B: enrichment of potential factors in endothelial, epithelial, immune, and mesenchymal cells. Node size is proportional to the significance (–log10 transformed) of factor in each cell type. Node color is proportional to percentage of genes associated with the factor in a given cell type.

