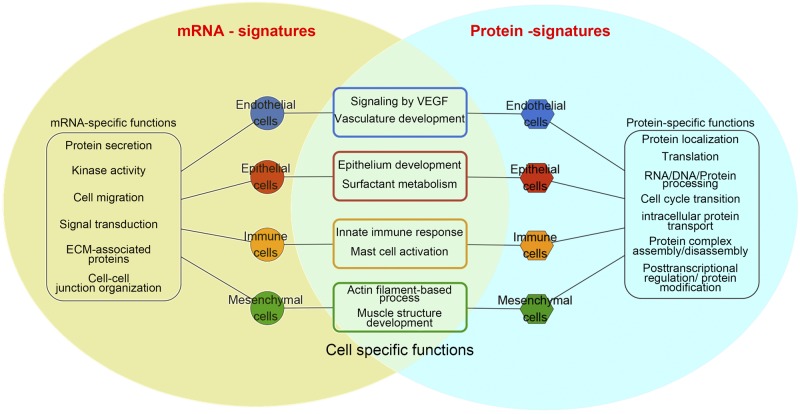
Fig. 8.
Summary of transcriptomic and proteomic profiling of human major cell types. The Venn diagram compares signatures identified from transcriptomic and proteomics analyses. The common bioprocesses and pathways represented by coherently expressed signatures are shown in the overlap area. Functional annotations related to noncoherent mRNA signatures are represented in the yellow portion of the Venn diagram and predicted functions derived from noncoherent protein signatures are depicted in the blue portion of the Venn diagram. Overall correlations between mRNA and protein levels were relatively low (~0.4), but cell-specific functions and processes serving as characteristics of each cell type are most represented by coherently expressed mRNA/protein signatures. ECM, extracellular matrix.

