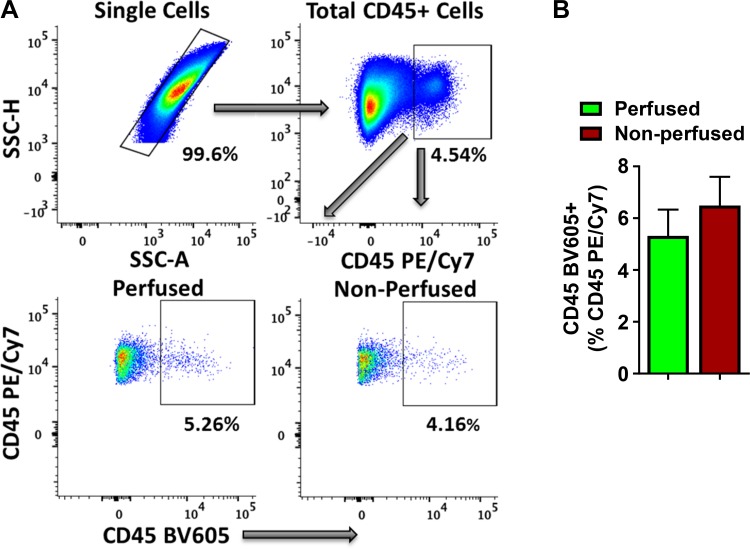
Fig. 3.
A: representative flow cytometry scatter plots for single cells (top, left), total CD45+ (PE/Cy7+) leukocytes in single cell gate (top, right), and intravascular CD45+ (BV605+) cells in total CD45+ (PE/Cy7+) leukocytes in mouse cardiac digests 1-day post-MI with (bottom, left) or without (bottom, right) ex vivo retrograde coronary perfusion. B: quantitative group data from A. Data were analyzed using 2-tailed unpaired Student’s t-test (n = 4 in perfused and 5 in the nonperfused group). Part of the quantitative data was also shown in Bansal et al. (6).

