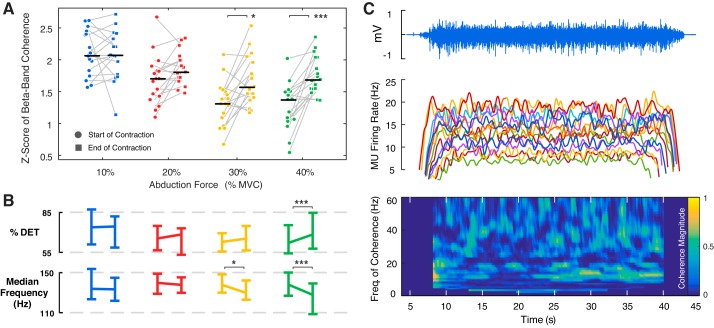
Fig. 6.
A: median and interquartile range of the Fisher-transformed coherence values in the beta-band range during the first and second half of the constant force contraction across all subjects. B: median and SD of the percentage determinism (%DET) and the median frequency of the surface electromyography (EMG) signal. C: surface EMG, motor unit (MU) mean firing rates, and the wavelet coherence during a single force trial at 30% maximal voluntary contraction (MVC) in a representative subject. *P < 0.05; ***P < 0.001.

