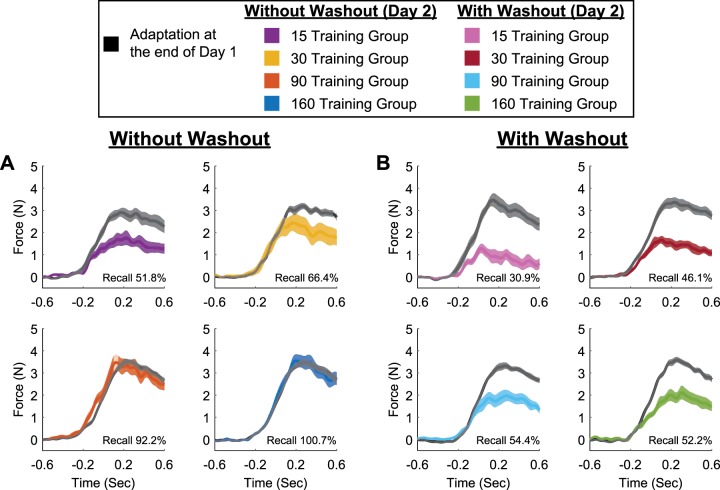
Fig. 6.
Recall of novel movement dynamics following a single perturbation. Temporal force profiles are shown on day 1 and day 2 of training for the without-washout (A) and with-washout (B) groups. Black traces represent asymptotic performance on day 1, whereas colored traces represent the initial single-trial performance on day 2. Background shading represents SE. Percentages represent the recall by comparison of the temporal force profiles on days 1 and 2.

