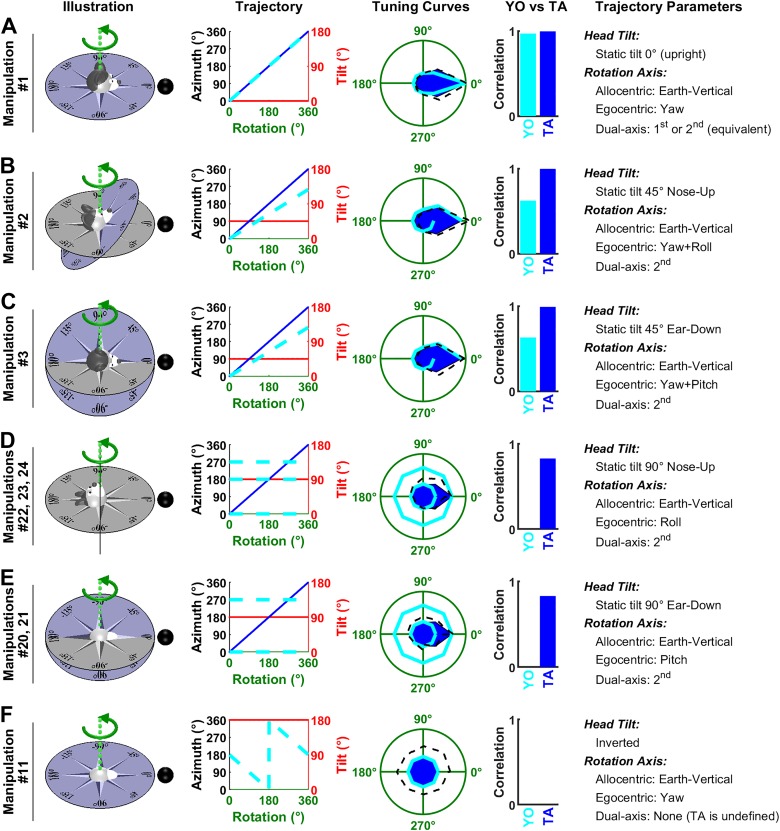
Fig. 6.
Analysis of Shinder and Taube’s (2019) manipulations: rotations around an earth-vertical axis. Experimental conditions in Shinder and Taube (2019) are named “manipulations” here, numbered 1 to 27 (see their Fig. 3). Each line corresponds to one manipulation, or to multiple manipulations that follow the same trajectory (with different starting positions). Illustration: representation of the motion trajectories with the head at 0°. The gray and blue azimuth frames represent an earth-fixed and tilted azimuth (TA) compass, respectively. Green, rotation axis. Black sphere, cell’s preferred direction (PD) when the animal is upright. Trajectory: head azimuth [in TA and yaw-only (YO) frames: blue and cyan, respectively] and tilt (red) resulting from a rotation of ± 180° relative to the 0° position. Tuning Curves: simulations of each model are compared with experimental results. Firing rate is represented in polar coordinate for consistency with Shinder and Taube (2019) and normalized to 1 (green circle) when facing the PD in upright orientation. Blue: simulated firing of a cell encoding TA; Cyan: simulated firing rate of a cell encoding YO azimuth; black, experimental results of Shinder and Taube (2019). When the trajectory corresponds to multiple manipulations, the corresponding results are averaged. YO versus TA: correlation between the tuning curves predicted by the YO and TA models and the average head direction cell (HDC) response. Correlations were computed independently for each manipulation and averaged across manipulations. Trajectory Parameters: description of the trajectory, including head tilt, the position of the rotation axis in allocentric and egocentric coordinates, and decomposition of the rotation axis based on the dual-axis rule. Manipulations 1 (A), 2 (B), 3 (C), 22–24 (D), 20 and 21 (E), and 11 (F) are animated in Supplemental Movie S1, available at https://github.com/JeanLaurens/Modelling-3D-HD-Cell-Tuning.

