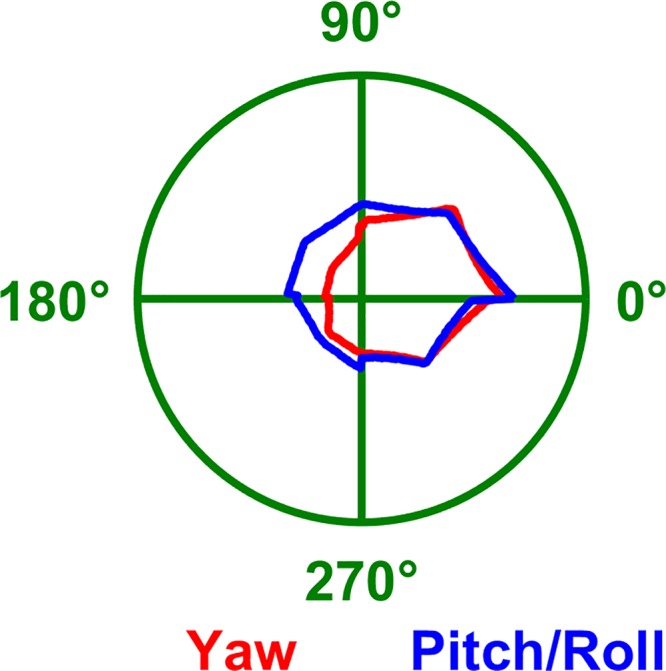
Fig. 10.

Average azimuth tuning curves measured by Shinder and Taube (2019) with the head tilted 90°. Red: tuning curve during yaw rotations in the earth-vertical plane (average of all manipulations in Fig. 7). This tuning is based on the 1st-axis rule. Blue: tuning curve during pitch and roll rotations in the earth-horizontal plane (average of all manipulations in Fig. 6, D and E). This tuning is based on the 2nd-axis rule. As predicted by the TA/dual-axis model, the two curves are highly correlated (ρ = 0.9). In contrast, the yaw-only (YO) model would predict no tuning during pitch/roll (blue).
