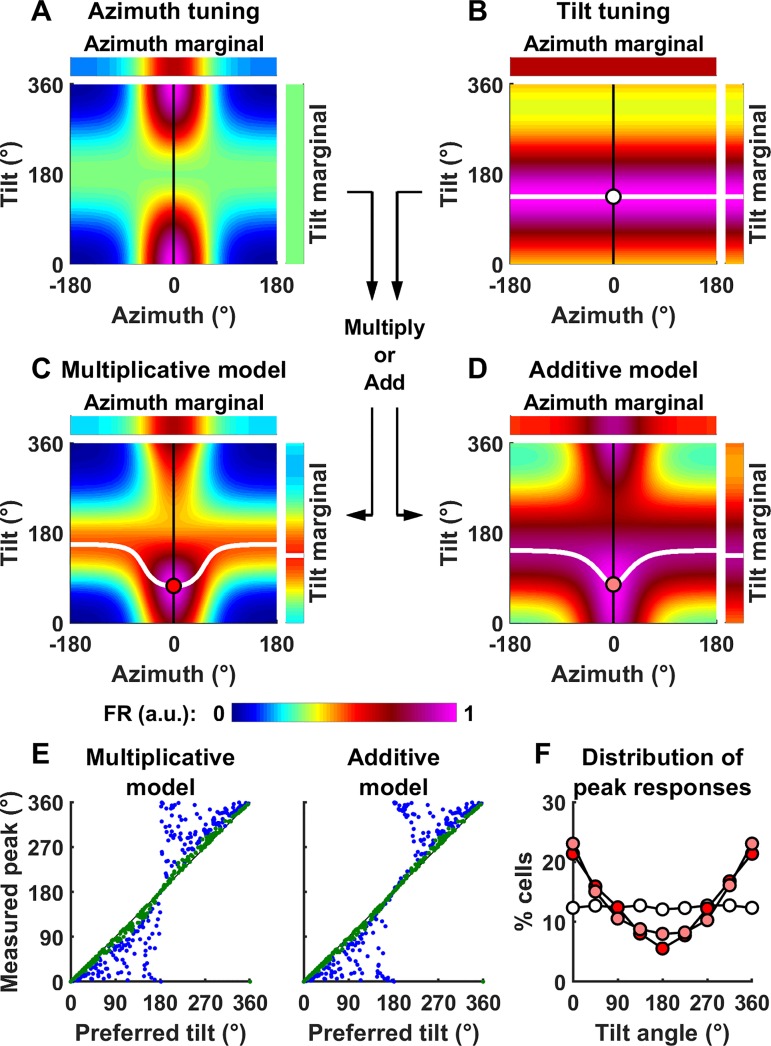
Fig. 11.
Why the pitch/roll rotations when facing the cell’s preferred direction (used by Shinder and Taube) are inappropriate to test for tilt tuning. A–D: simulation of a model conjunctive cell, as in Fig. 4, but with different parameters such that azimuth tuning (κ = 2 and kG = 1, where κ is the von Mises function’s parameter and kG is maximum tuning gain) is now stronger than tilt tuning (λ = 0.5 and kTilt = 1, where λ is the coefficient of the von Mises distribution and kTilt a gain factor). The solid white lines in B–D indicate the tilt angle at which firing peaks, as a function of azimuth. The tilt tuning function in B, where tilt tuning is independent of azimuth and peaks at 135°, is multiplied by or added to the azimuth tuning function (A) to produce the tuning curves in C and D. The white (B), red (C), or pink (D) markers indicate the tilt angle at which firing peaks when facing 0° azimuth, i.e., the cell’s PD: note the bias toward upright. E: peak response measured during pitch or roll, as a function of the cell’s preferred tilt angle, in 500 simulated cells (kG and are kTilt set to 1, κ and λ are drawn randomly such that the Rayleigh vector length of azimuth and tilt tuning curves are distributed uniformly). Green/blue dots: cells where tilt tuning is higher/lower than azimuth tuning. F: distribution of the preferred tilt angle (white markers) and of the angle at which the peak response occurs (red/pink: multiplicative/additive model). a.u., Arbitrary units; FR, firing rate.

