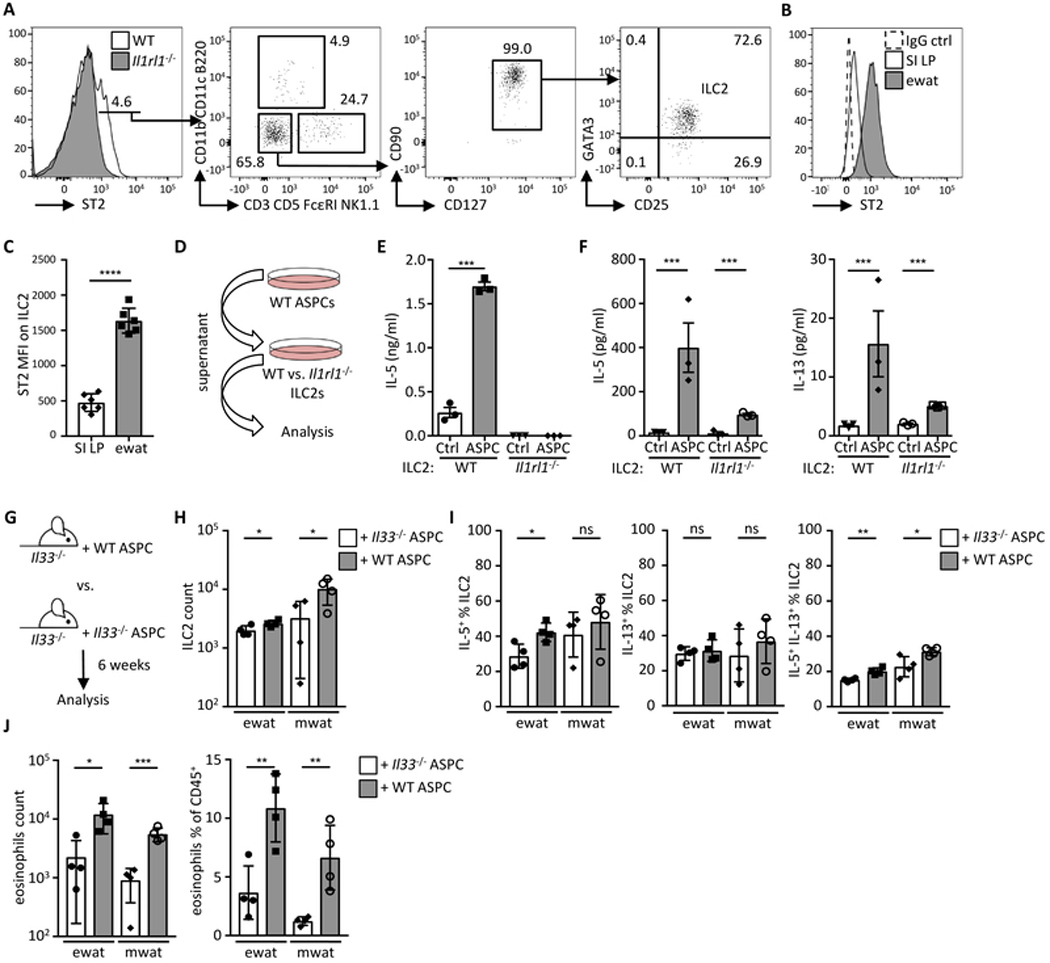
Fig. 4.

Adipose stem and progenitor cell-derived IL-33 controls ILC2 activity. (A) Representative histogram and dot plots showing ST2+ cells in the lymphocyte population first gated on live CD45+ cells. (B) Representative histogram of ST2 expression on ILC2 (defined as shown in fig. S9A) from the small intestinal lamina propria (SI LP) and epididymal WAT (ewat). (B and C) Representative histogram (B) and bar graph (C) showing mean fluorescence intensity (MFI) of ST2 on ILC2s from ewat and SI LP. (n = 6) (D) Schematic indicating experimental design for E and F. (E) Sort-purified ILC2s from wild type (WT) or Il1rl1−/− mouse visceral WAT (pooled ewat and mwat) ILC2s were cultured in ASPC-conditioned (ASPC) or control media (Ctrl) and IL-5 secretion was analyzed by ELISA after 48 h. (n = 3) (F) Sort-purified ILC2s from visceral WAT or SI LP were cultured in ASPC-conditioned or control media (Ctrl) and IL-5 and IL-13 secretion was analyzed by multiplex bead-based assay after 48 h. (n = 3) (G) Schematic indicating experimental design. Sort-purified ASPCs from wild type (WT) or Il33−/− mice were injected into the peritoneum of Il33−/− mice and immunological analysis (H-J) performed after six weeks in visceral adipose compartments. (H) ILC2 numbers, (I) proportions of IL-5+ and IL-13+ ILC2s, and (J) eosinophil quantification. (n = 4). Mean ± SEM, * P < 0.05, ** P < 0.01, ***P < 0.001, ns – not significant, Student’s t-test.
