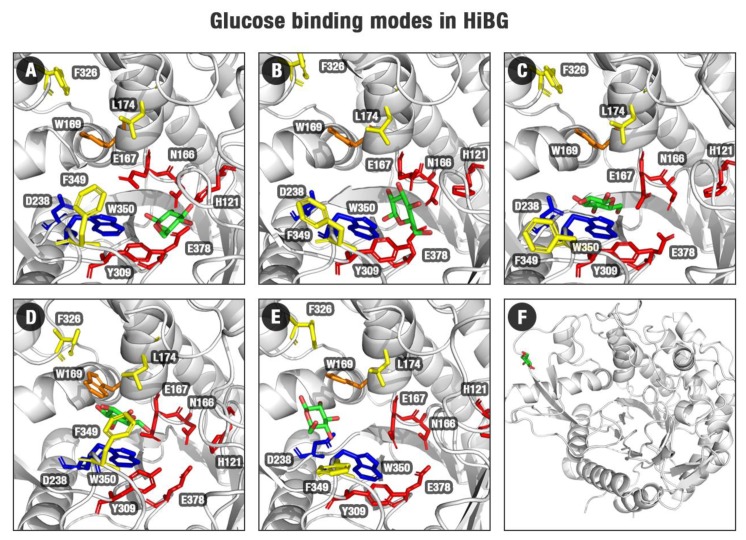
Figure 3.
Binding modes for HiBG in complex with glucose of the GH1–glucose FEL (Figure 2B) for the regions 1 (A), 2 (B), 3 (C), 4 (D), 5 (E), and 6 (F). Protein structures are shown in gray, subsite −1 (red sticks), subsite +1/+2 (yellow sticks), D238/W350 (blue sticks), W169 (orange sticks). The poses (selected from the minima at the FEL from Figure 2B) show a probable exit path for glucose from the HiBG active site.

