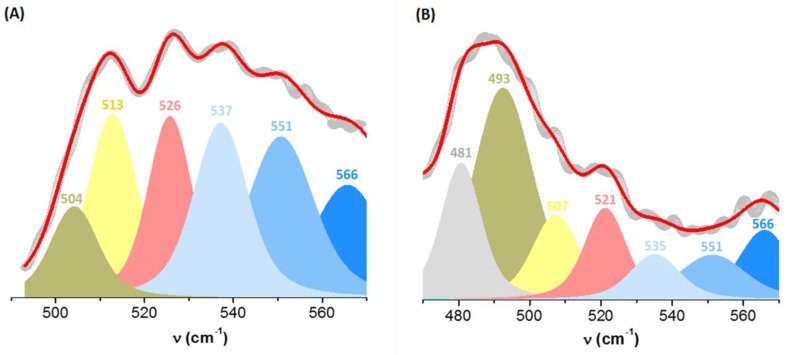
Figure 6.
Deconvolution of the Raman bands in the spectral range corresponding to the ν(S–S) vibrations: (A) free BSA (day 1, R2 = 0.995), (B) BSA adsorbed onto gold nanoparticles (day 40, R2 = 0.994); the experimental spectra are depicted by grey dots, the convoluted spectra by red lines and the individual component functions are in color.

