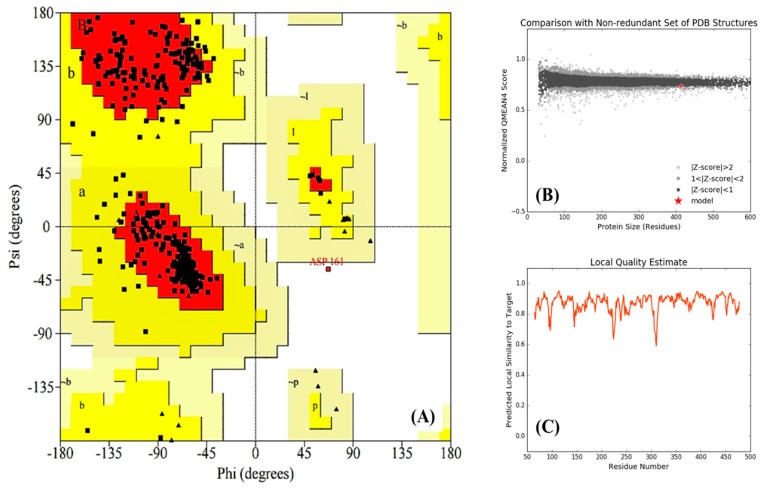
Figure 4.
Validation of the generated homology model of Fophy. (A) Ramachandran plot, (B) comparison plot, and (C) local quality plot. For more information about Ramachandran plot descriptions the reader should be referred to the web site at (https://www.ebi.ac.uk/thornton-srv/databases/cgi-bin/pdbsum/GetPage.pl?doc=TRUE&pdbcode=n/a&template=doc_procheck01.html).

