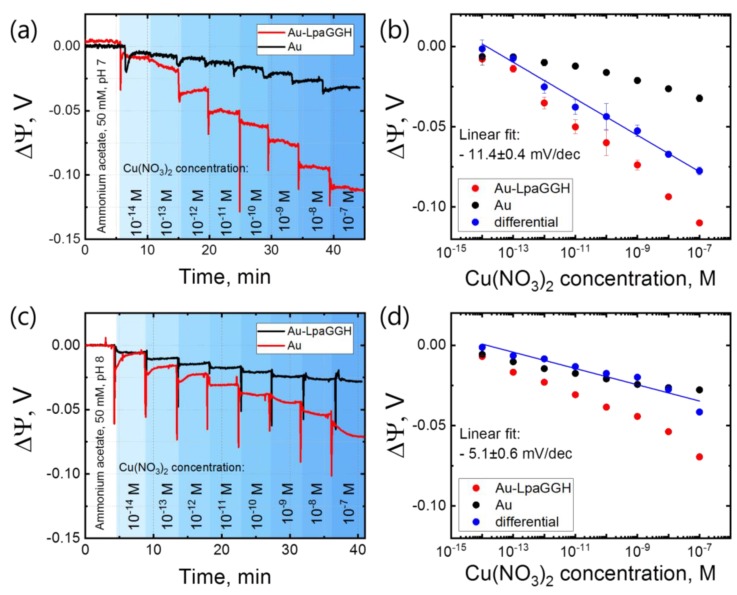
Figure 2.
Response of the GGH ligand to Cu(NO3)2 in the concentration range of 10 fM to 0.1 µM. Real-time measurements of the surface potential shift ΔΨ for increasing concentrations of Cu(NO3)2 in ammonium acetate (50 mM), pH 7 (a) and pH 8 (c). For drift correction, a baseline is subtracted from the measured data and the measured curves are shifted to zero (see Methods). (b,d) Differential response at pH 7 and 8, respectively (see Methods). The reported surface potential values are extracted from “steps” after 1 min settling time, and buffer baseline is shifted to zero.

