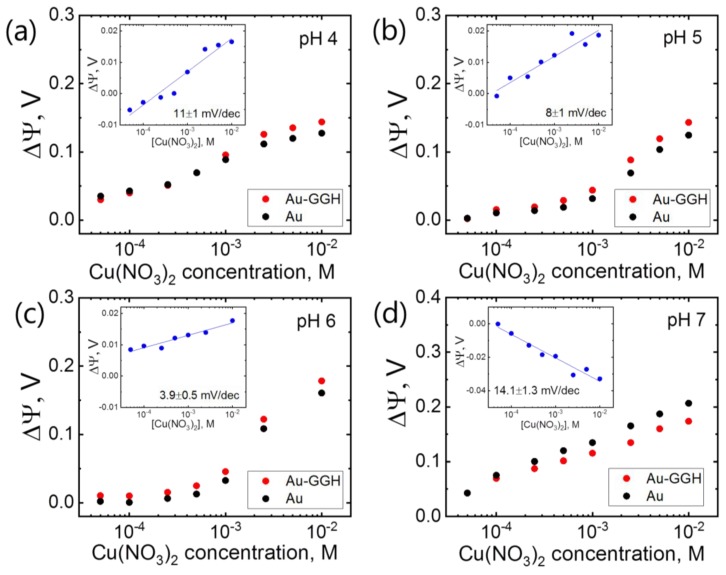
Figure 3.
Response to Cu2+ ions at high concentrations (0.05–10 mM) in Titrisol buffer at (a) pH 4 (105 mM, HCl 0.044, NaOH 0.11, C6H8O7 0.056 mol/l), (b) pH 5 (148 mM, NaOH 0.2, C6H8O7 0.096 mol/l), (c) pH 6 (83 mM, NaOH 0.16, C6H8O7 0.06 mol/l), (d) pH 7, ammonium acetate (50 mM). The signal is averaged over all measured nanoribbons (12 active and 12 control). All insets show the differential response.

