Figure 2.

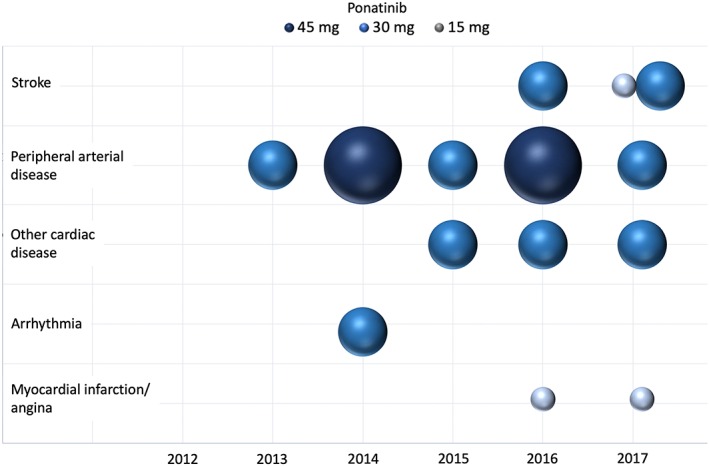
Bubble chart displaying 14 occlusive events that occurred from 2012 to 2017 in 85 patients treated with different doses of ponatinib. The diameter of the area of the bubble represent the dose of ponatinib (15, 30, or 45 mg)

Bubble chart displaying 14 occlusive events that occurred from 2012 to 2017 in 85 patients treated with different doses of ponatinib. The diameter of the area of the bubble represent the dose of ponatinib (15, 30, or 45 mg)